# Testing Fault Tolerance
This lab will test the high availability and fault tolerance features provided by Amazon Aurora. You can find more details on the high availability features and connection management best practices in our documentation. These tests are designed to touch upon the most important aspects of failure recovery, and are not intended to be exhaustive for all failure conditions.
??? tip "Learn more about High Availability in Amazon Aurora"
In Amazon Aurora, high availability (HA) is implemented by deploying a cluster with a minimum of two DB instances, a writer in one Availability Zone, and a reader in a different Availability Zone. We call this configuration **Multi-AZ**. If you have provisioned the DB cluster using CloudFormation in the [Prerequisites](/modules/prerequisites/) lab, or have created the DB cluster manually, by following the [Creating a New Aurora Cluster](/modules/create) lab, you have deployed a **Multi-AZ** Aurora DB cluster.
In the event of a failure, Amazon Aurora will either restart the database engine within the same DB instance, or promote one of the reader DB instances as the new writer, depending on the circumstances, to restore operations as quickly as possible. It is therefore recommended to use the relevant DB cluster endpoints to connect to Amazon Aurora, as the role of 'writer' can shift from one DB instance to another in the event of a fault, and the cluster endpoints are always updated to reflect such changes.
Your client application should not cache the resolved DNS response for these endpoints beyond the specified time-to-live (TTL) - typically 5 seconds, should attempt to reconnect if disconnected, and should always verify whether the connected DB instance has the intended role (writer or reader).
This lab contains the following tasks:
1. Set up failover event notifications
2. Test a manual DB cluster failover
3. Test fault injection queries
4. Test a failover with cluster awareness
5. Use RDS Proxy to minimize failover disruptions
6. More testing suggestions
7. Cleanup lab resources
This lab requires the following prerequisites:
* [Get Started](/prereqs/environment/)
* [Connect to the Cloud9 Desktop](/prereqs/connect/)
* [Create a New DB Cluster](/provisioned/create/) (conditional, only if you plan to create a cluster manually)
* [Connect to the DB Cluster and Load Data](/provisioned/interact/)
## 1. Set up failover event notifications
To receive notifications when failover events occur with your DB cluster, you will create an Amazon Simple Notification Service (SNS) topic, subscribe your email address to the SNS topic, create an RDS event subscription publishing events to the SNS topic and registering the DB cluster as an event source.
If you have not already opened a terminal window in the Cloud9 desktop in a previous lab, please [following these instructions](/prereqs/connect/) to do so now. Once opened, run:
```
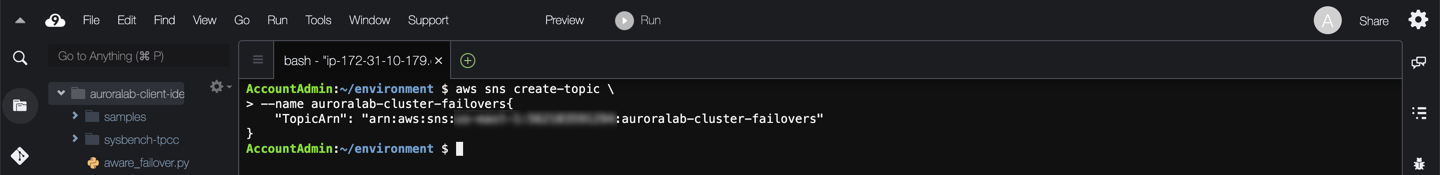
aws sns create-topic \
--name auroralab-cluster-failovers
```
If successful, the command will respond back with a **TopicArn** identifier, you will need this value in the next command.
Next, subscribe your email address to the SNS topic using the command below, changing the placeholder ==[YourEmail]== with your email address:
```
aws sns subscribe \
--topic-arn $(aws sns list-topics --query 'Topics[?contains(TopicArn,`auroralab-cluster-failovers`)].TopicArn' --output text) \
--protocol email \
--notification-endpoint '[YourEmail]'
```
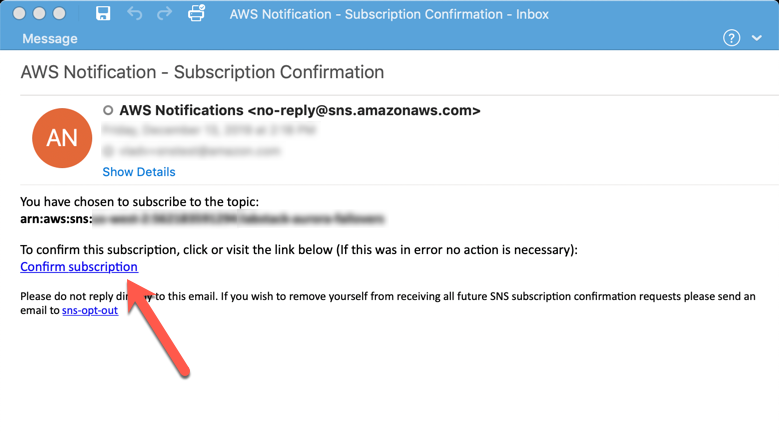
You will receive a verification email on that address, please confirm the subscription by following the instructions in the email.
Once confirmed, or while you are waiting for the verification email to arrive, create an RDS event subscription and register the DB cluster as an event source using the command below:
```
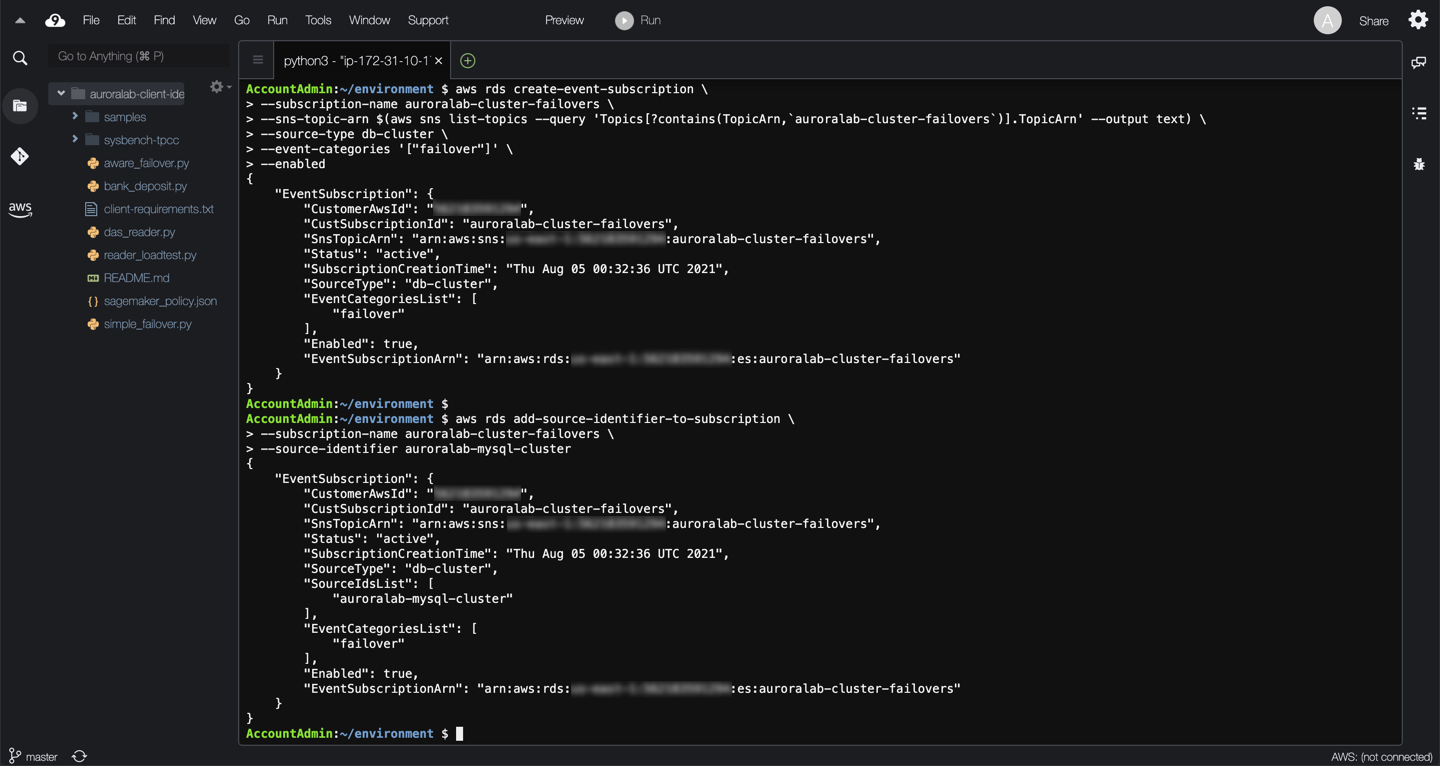
aws rds create-event-subscription \
--subscription-name auroralab-cluster-failovers \
--sns-topic-arn $(aws sns list-topics --query 'Topics[?contains(TopicArn,`auroralab-cluster-failovers`)].TopicArn' --output text) \
--source-type db-cluster \
--event-categories '["failover"]' \
--enabled
aws rds add-source-identifier-to-subscription \
--subscription-name auroralab-cluster-failovers \
--source-identifier auroralab-mysql-cluster
```
At this time the event notifications have been configured. Ensure you have verified your email address before proceeding to the next section.
## 2. Testing a manual DB cluster failover
In this test you will use a [simple failover monitoring script](/scripts/simple_failover.py) to check the status of the database.
??? tip "Learn more about the simple monitoring script"
The script is designed to monitor the writer DB instance. It will attempt to connect to the DB cluster's **Cluster Endpoint**, and check the status of the DB instance by executing the following SQL query:
```
SELECT @@innodb_read_only, @@aurora_server_id, @@aurora_version;
```
Variable | Expected Value | Description
--- | --- | ---
innodb_read_only | `0` for writers, `1` for readers | This global system variable indicates whether the storage engine was opened in read-only mode or not.
aurora_server_id | `auroralab-[...]` | This is the value of the DB instance identifier configured for that particular cluster member at creation time
aurora_version | e.g. `2.10.0` | This is the version of the Amazon Aurora MySQL database engine running on your DB cluster. Note, these version numbers are different than the MySQL version.
In the event of a fault, the script will report the number of seconds it takes to reconnect to the intended endpoint and the writer role.
If you have not already opened a terminal window or the Cloud9 desktop in a previous lab, please [following these instructions](/prereqs/connect/) to do so now. You will need an additional terminal window as well. You will execute commands in one, and see the results in the other window. See [Connect to the Cloud9 Desktop](/prereqs/connect/), for steps how to change the layout to have two terminal windows side by side.
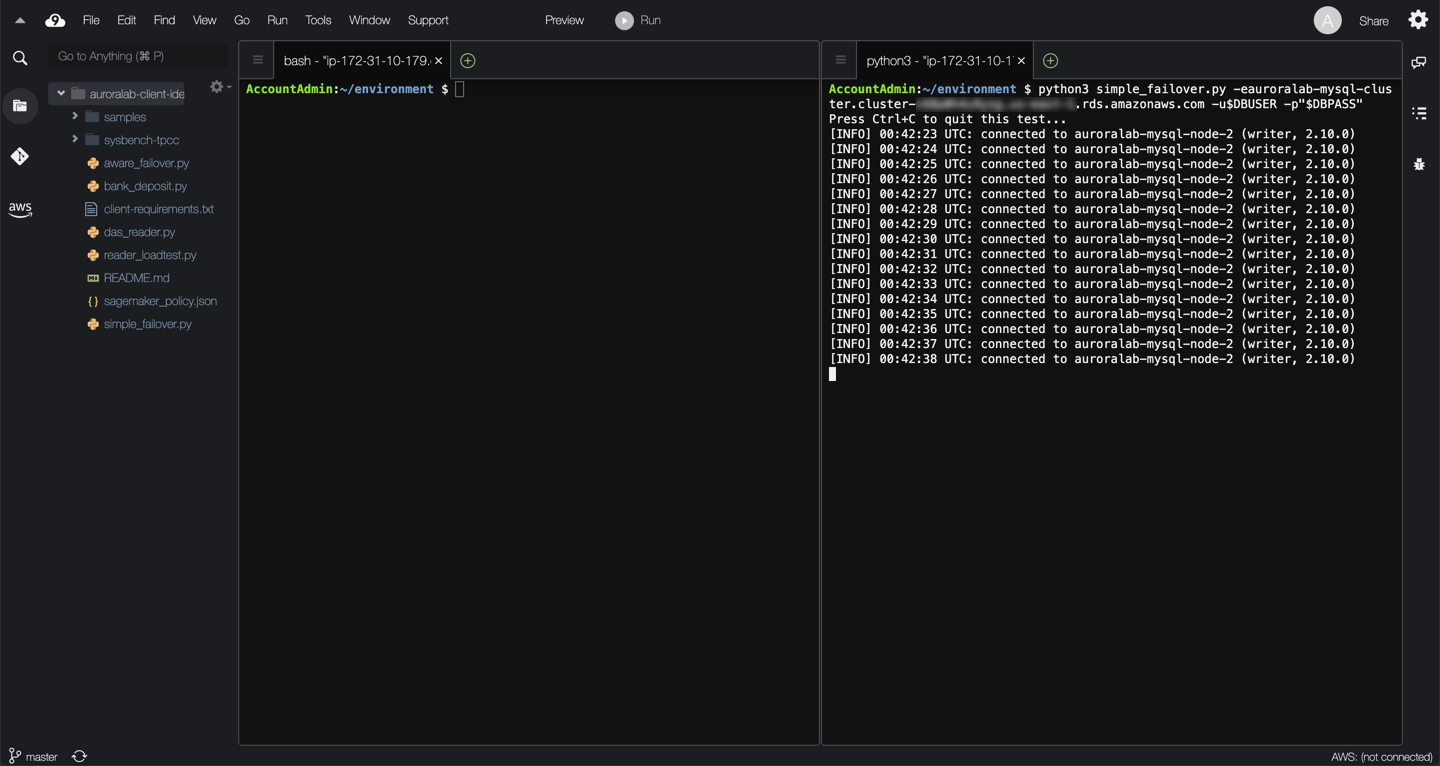
In one of the two command line sessions, start the monitoring script using the following command:
```
python3 simple_failover.py -e[clusterEndpoint] -u$DBUSER -p"$DBPASS"
```
You can quit the monitoring script at any time by pressing `Ctrl+C`.
!!! warning "Cluster Endpoint"
Please ensure you use the **Cluster Endpoint** and not a different endpoint for the purposes of this test. If you encounter an error, starting the script, please verify that the endpoint is correct.
In the other command line session, you will trigger a manual failover of the cluster. During this process, Amazon Aurora will promote the reader as the new writer DB instance and demote the old writer to a reader role. The process will take several seconds to complete and will disconnect the monitoring script as well as other database connections. All DB instances in the cluster will be restarted.
Enter the following command in the command line session that does not run the monitoring script:
```
aws rds failover-db-cluster \
--db-cluster-identifier auroralab-mysql-cluster
```
Wait and observe the monitor script output. It can take some time for Amazon Aurora to initiate the failover. Once the failover occurs, you should see monitoring output similar to the example below.
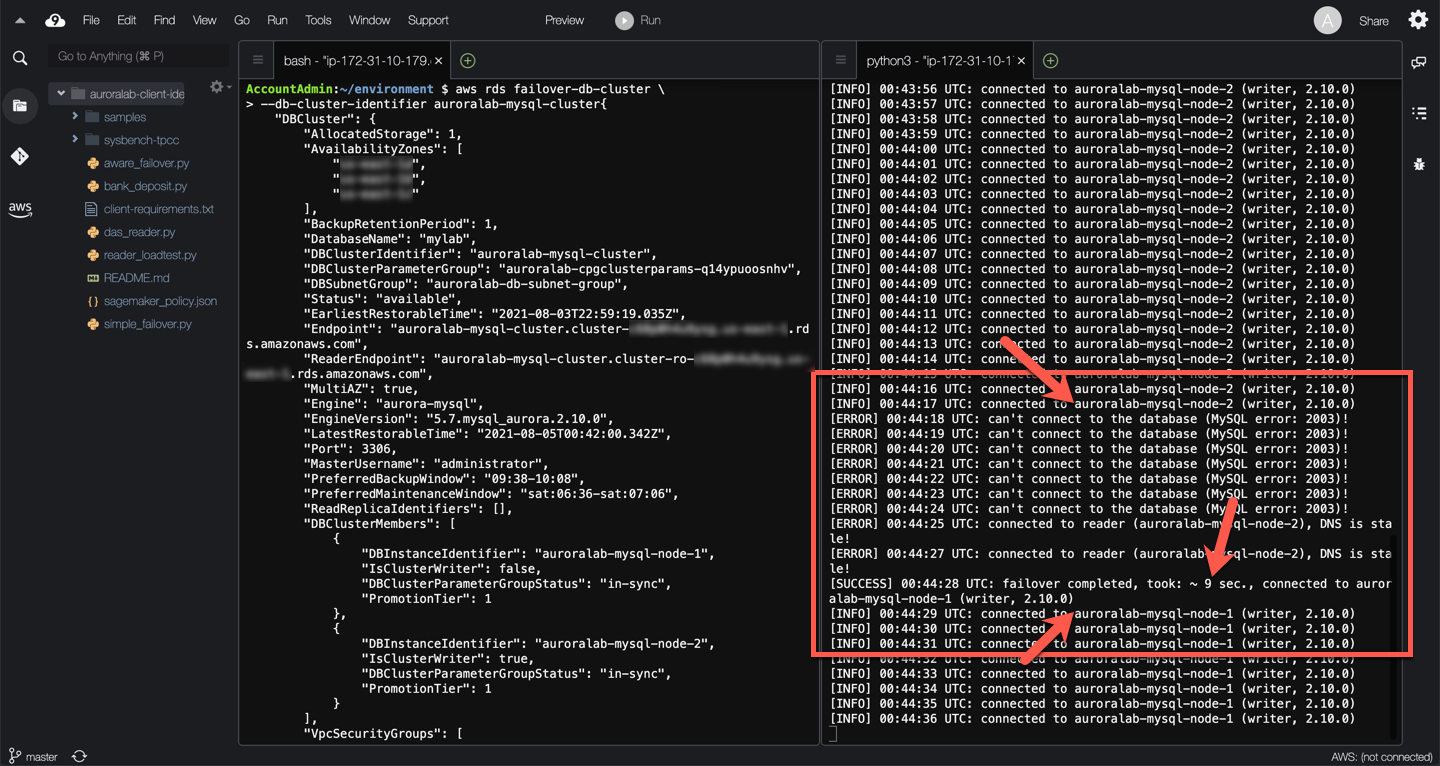
??? info "Observations"
Initially, the Cluster DNS endpoint resolves to the IP address of one of the cluster DB instances (`auroralab-mysql-node-2` in the example above). The monitoring script connects to that particular DB instance and determines it is a writer.
When the actual failover is implemented by the AWS automation, the monitoring script stops being able to connect to the database engine, as both the writer and the reader DB engines are being rebooted and re-configured.
After several seconds, the monitoring script is able to connect again to the DB engine, but DNS has not fully updated yet, so it still connects to the old writer DB instance, which is now a reader. This underscores the importance of verifying the role of the engine upon establishing connections or borrowing them from a connection pool. The monitoring script correctly detects the discrepancy, and continues attempting to re-connect to the correct endpoint.
After several additional seconds, the monitoring script is able to connect to the correct new writer DB instance (`auroralab-mysql-node-1` in the example above), after the cluster endpoint has been re-configured automatically to point to the new writer, and DNS TTL has expired client-side. In the example above, the total client side observed failover disruption was ~9 seconds.
In the event of a true hardware failure, you will likely not be able to connect to the old writer instance. But the client may attempt to connect until the attempt times out. A very long `connect_timeout` value in the client MySQL driver configuration may delay recovery for a longer period of time. However, there are other use cases where you would want to initiate a manual failover, such as scaling the compute of writer DB instances with minimal disruption.
Because of the nature of DNS resolution and caching, you may also experience a *flip-flop* effect as clients might cycle between the reader and writer for a short span of time following the failover.
Feel free to repeat the failover procedure a few times to determine if there are any significant variances.
You will also receive two event notification emails for each failover you initiate, one indicating that a failover has **started**, and one indicating that it has **completed**.
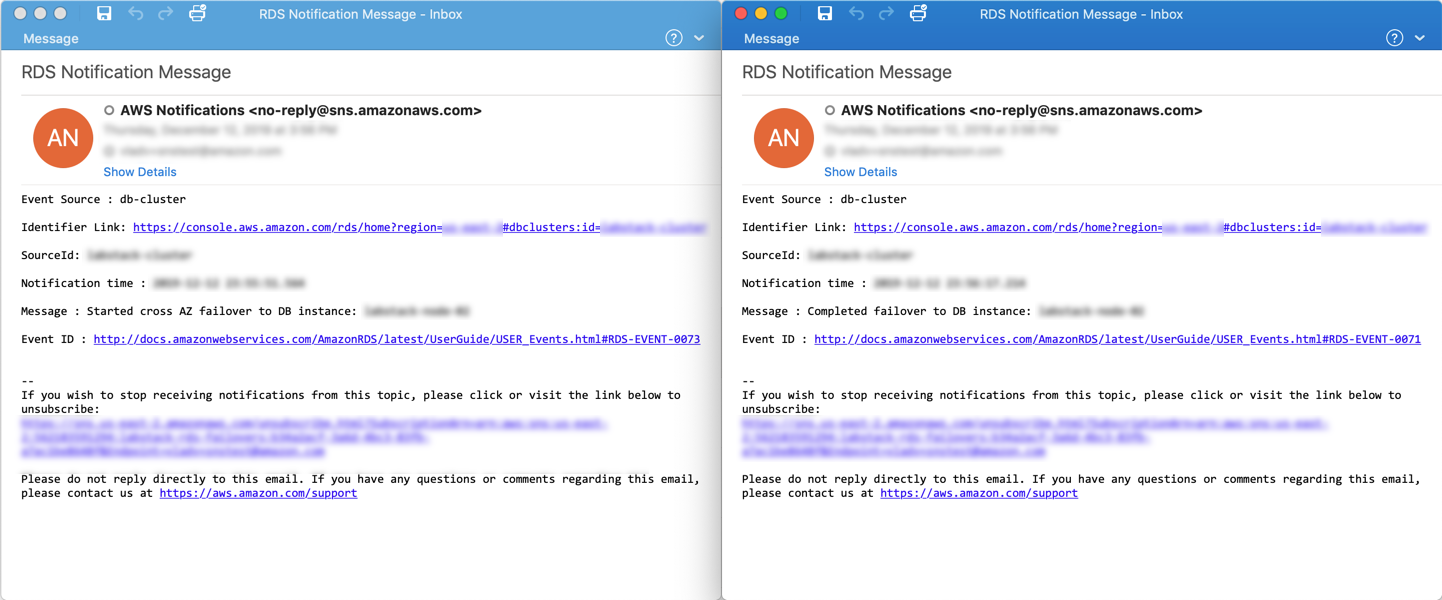
!!! note
The difference between the notification timestamps of the two event notifications may be larger than the actual disruption observed using the monitoring script. The monitoring script measures the actual disruption observed by the client, while the event notification reflects the end-to-end failover process, including subsequent service-side validations once the DB cluster is operational again.
## 3. Testing fault injection queries
In this test you will simulate a crash of the database engine service on the DB instance. This type of crash can be encountered in real circumstances as a result of out-of-memory conditions, or other unexpected circumstances.
??? tip "Learn more about fault injection queries"
Fault injection queries provide a mechanism to simulate a variety of faults in the operation of the DB cluster. They are used to test the tolerance of client applications to such faults. They can be used to:
* Simulate crashes of the critical services running on the DB instance. These do not typically result in a failover to a reader, but will result in a restart of the relevant services.
* Simulate disk subsystem degradation or congestion, whether transient in nature or more persistent.
* Simulate read replica failures
Connect to the cluster endpoint using a MySQL client in the terminal window that does not run the monitoring script:
```
mysql -h[clusterEndpoint] -u$DBUSER -p"$DBPASS" mylab
```
Now, issue the following fault injection command:
```
ALTER SYSTEM CRASH INSTANCE;
```
Wait and observe the monitor script output. Once triggered, you should see monitoring output similar to the example below.
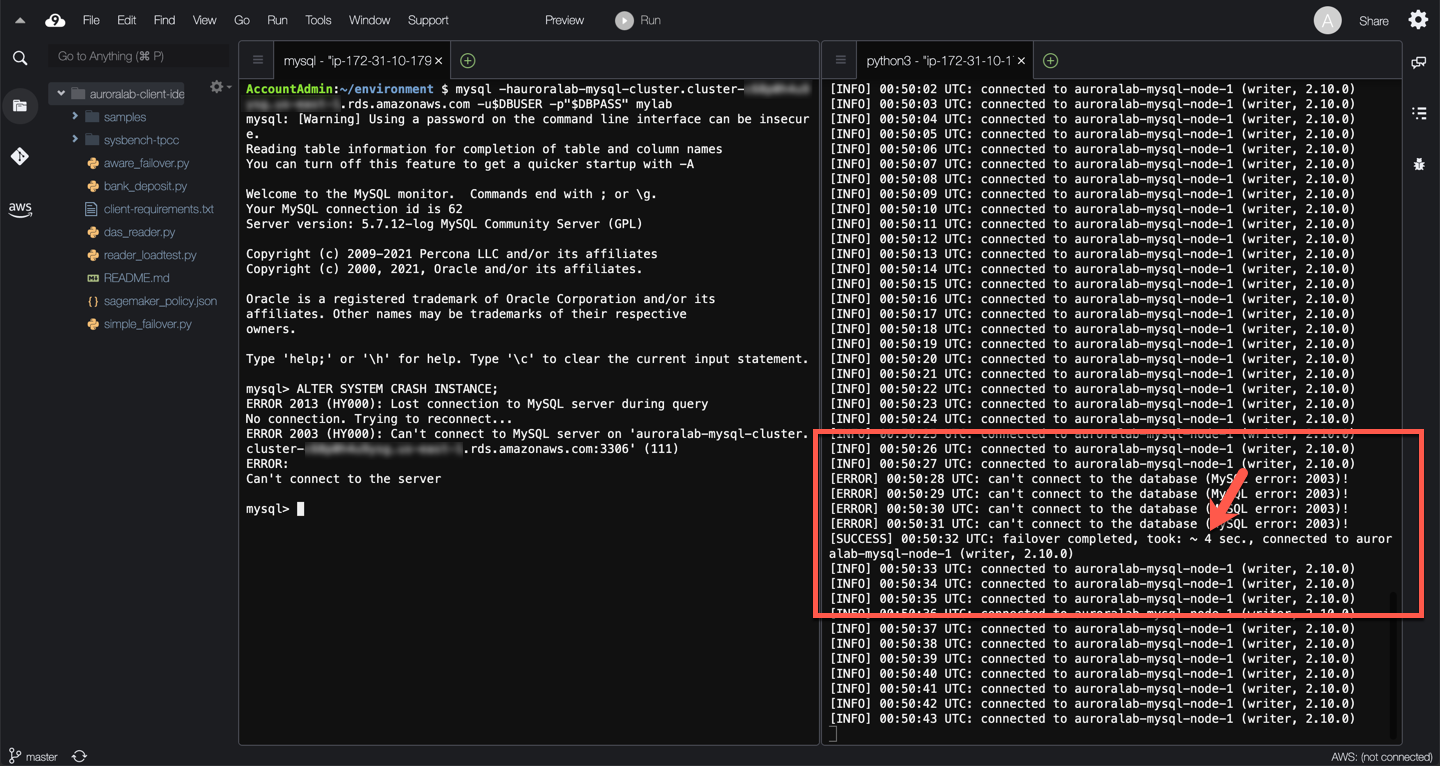
??? info "Observations"
When the crash is triggered, the monitoring script stops being able to connect to the database engine.
After a few seconds the monitoring script is able to connect again to the DB engine.
The role of the DB instance has not changed, the writer is still the same DB instance (`auroralab-mysql-node-1` in the example above).
No DNS changes are needed. As a result the recovery is significantly faster. In the example above, the total client side observed failover disruption was 4 seconds.
You may need to exit the mysql command console, even if it is disconnected using by typing:
```
quit;
```
## 4. Testing a failover with cluster awareness
Simple DNS-based failovers work well for most use cases, and they are relatively fast. However, as you have noticed there are still several seconds of connectivity disruption due to DNS update and expiration delays, including the DNS flip-floping effect. Thus failover times can be improved further. In this test you will use a basic [cluster-aware monitoring script](/scripts/aware_failover.py), and compare it side by side with the simple monitoring script used above.
??? tip "Learn more about the cluster-aware monitoring script"
The script is similar to the simple monitoring script above with a few significant differences:
* Initially, and after each failure, at re-connect it queries the DB cluster topology to determine the 'new' writer DB instance. The topology is documented in the `information_schema.replica_host_status` table in the database, and accessible from each DB instance.
* If the current DB instance is not the writer, it simply reconnects to the DB instance endpoint of the new writer directly.
* Upon encountering a new failure, it falls back to using the cluster DNS endpoint again.
Assuming you still have the two terminal windows open and active, open a 3rd terminal window. See [Connect to the Cloud9 Desktop](/prereqs/connect/), for steps how to change the layout to have multiple terminal windows side by side, the example below uses a **Cross Split** layout.
In the new (third) command line session, start the cluster-aware monitoring script using the following command:
```
python3 aware_failover.py -e[clusterEndpoint] -u$DBUSER -p"$DBPASS"
```
You can quit the monitoring script at any time by pressing `Ctrl+C`.
!!! note
Unlike the simple DNS monitoring script from step #2 above, you can even use the reader endpoint to invoke the cluster aware monitoring script. However the cluster endpoint is still recommended.
Enter the following command in the command line session that does not run any monitoring script, to trigger the failover:
```
aws rds failover-db-cluster \
--db-cluster-identifier auroralab-mysql-cluster
```
Wait and observe the monitor script output. It can take some time for Amazon Aurora to initiate the failover. Once the failover occurs, you should see monitoring output similar to the example below.
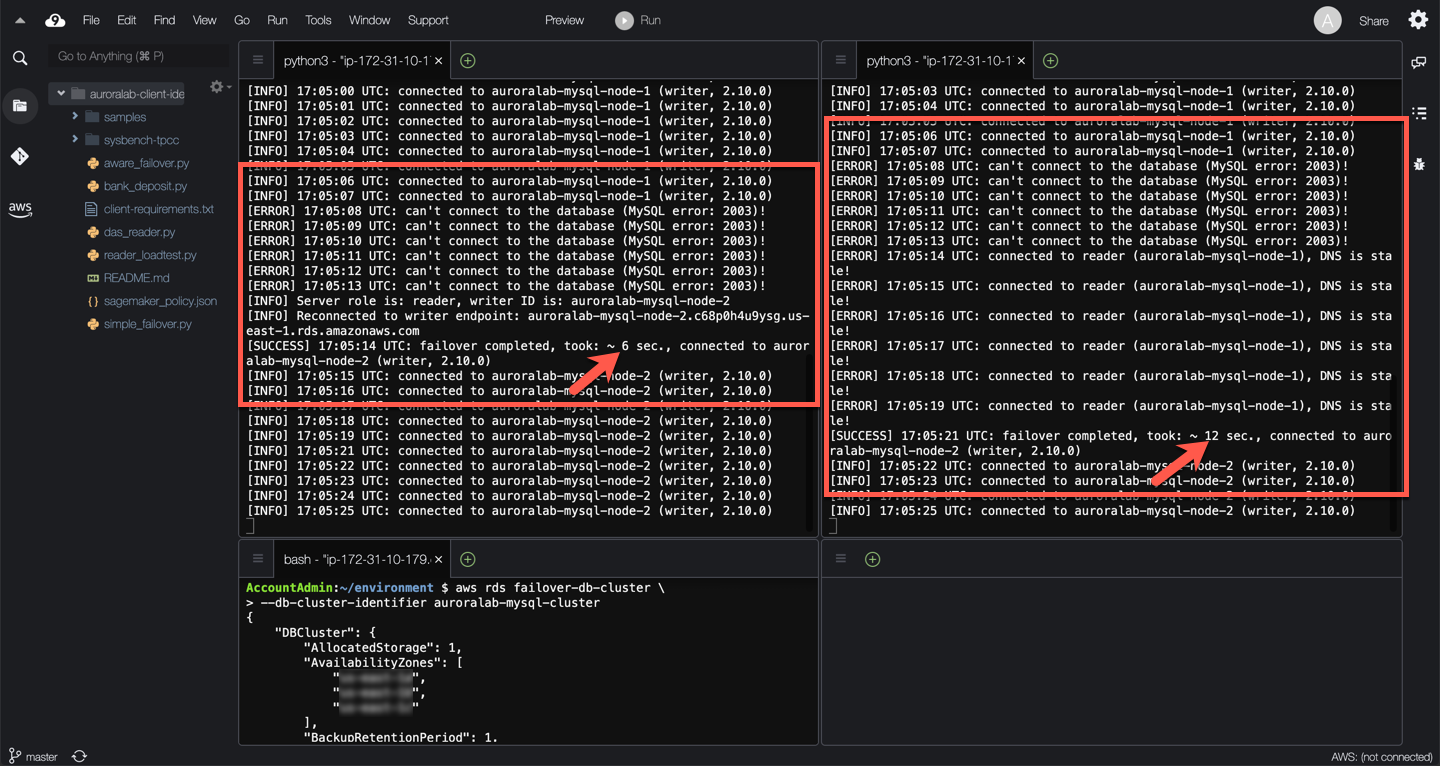
??? info "Observations"
When the crash is triggered, the monitoring script stops being able to connect to the database engine
After a few seconds the monitoring script is able to connect again to the DB engine, detects that the role of the DB instance has changed. It queries the topology of the cluster, discovers the new writer DB instance identifier and computes the DB instance endpoint.
It disconnects, and reconnects to the new DB writer directly using the DB instance endpoint.
In the example above, this process took 6 seconds to restore connectivity compared to 12 seconds when relying exclusively on the cluster DNS endpoint.
The initial cluster DNS endpoint is still authoritative and preferred, the cluster-aware monitoring script only uses the DB instance endpoint as long as it works, reverting back to the cluster endpoint when a failure is encountered. This ensures that connectivity is restored as quickly as possible even if there is a total compute failure of the writer DB instance.
Feel free to repeat the failover procedure a few times to determine if there are any significant variances.
As before, you will also receive two event notification emails for each failover you initiate, one indicating that a failover has **started**, and one indicating that it has **completed**.
## 5. Using RDS Proxy to minimize failover disruptions
In this test you will create an Amazon RDS Proxy for your DB cluster, use the [simple monitoring script](/scripts/simple_failover.py) to connect to it, invoke a manual failover and compare the results with the previous tests that connect directly to the database.
??? tip "Learn more about Amazon RDS Proxy"
Amazon RDS Proxy is a fully managed, highly available database proxy for Amazon Relational Database Service (RDS) that makes applications more scalable, more resilient to database failures, and more secure. RDS Proxy minimizes application disruption from outages affecting the availability of your database, by automatically connecting to a new database instance while preserving application connections. When failovers occur, rather than rely on DNS changes to reroute requests, RDS Proxy routes requests directly to the new database instance.
Open the Amazon RDS service console.
!!! warning "Region Check"
Ensure you are still working in the correct region, especially if you are following the links above to open the service console at the right screen.
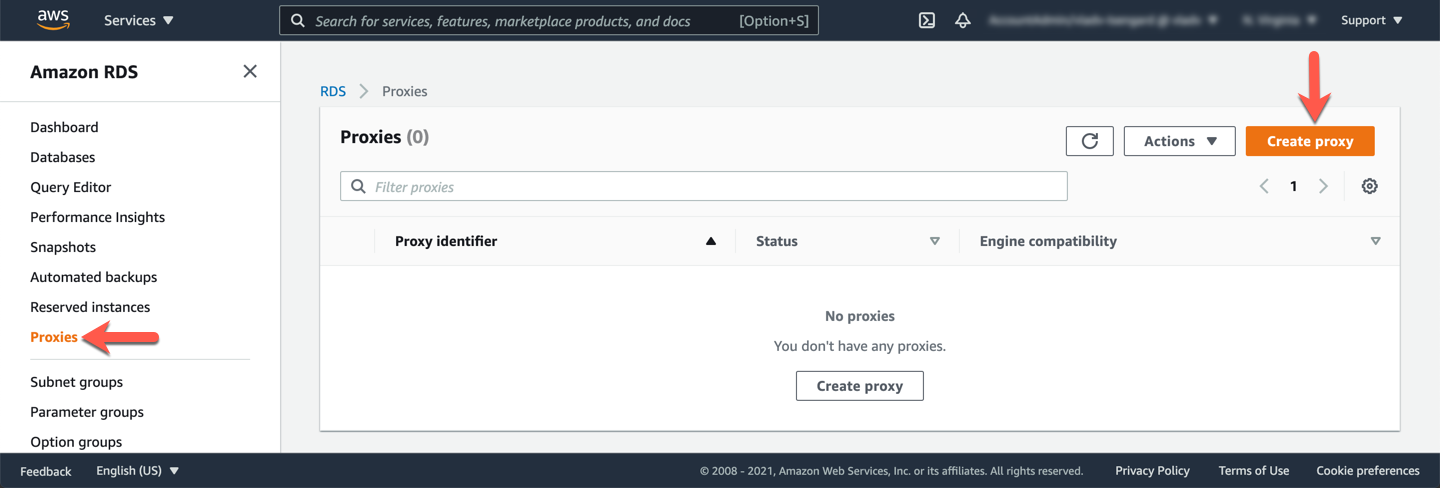
Navigate to **Proxies** in the left side navigation menu. Click **Create proxy**.
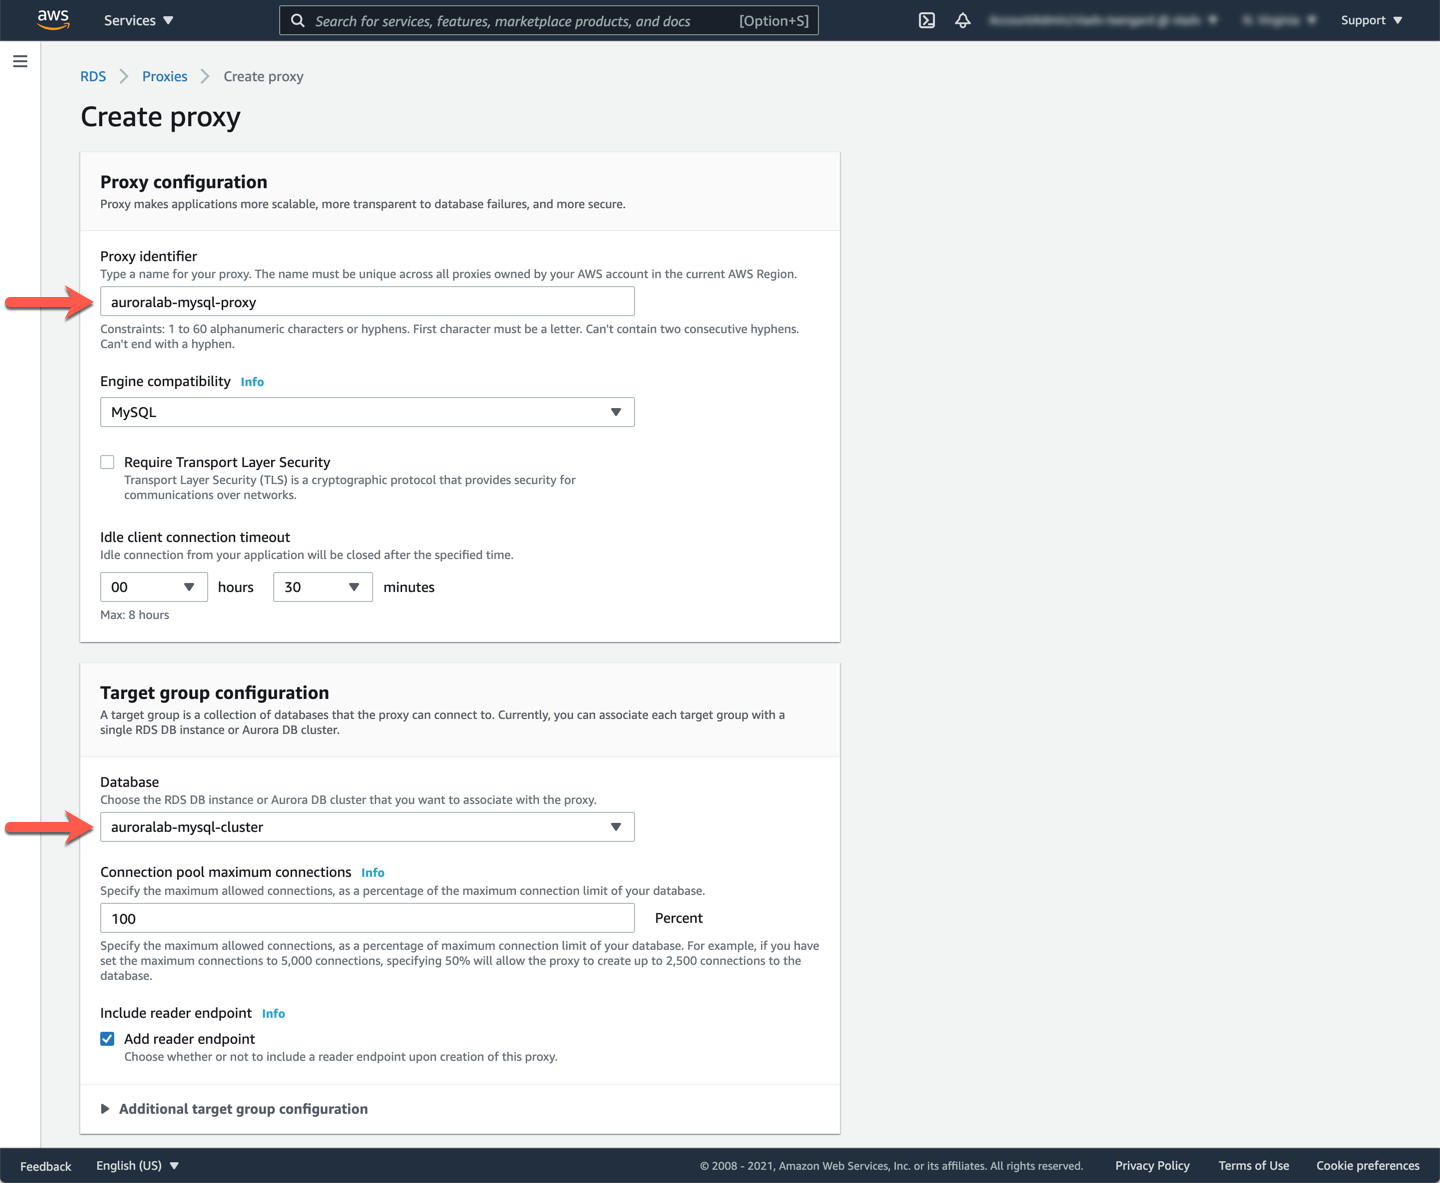
In the **Proxy configuration** section, set the Proxy identifier to `auroralab-mysql-proxy`. In the **Target group configuration** section, choose `auroralab-mysql-cluster` in the **Database** dropdown. Leave all other default values as they are.
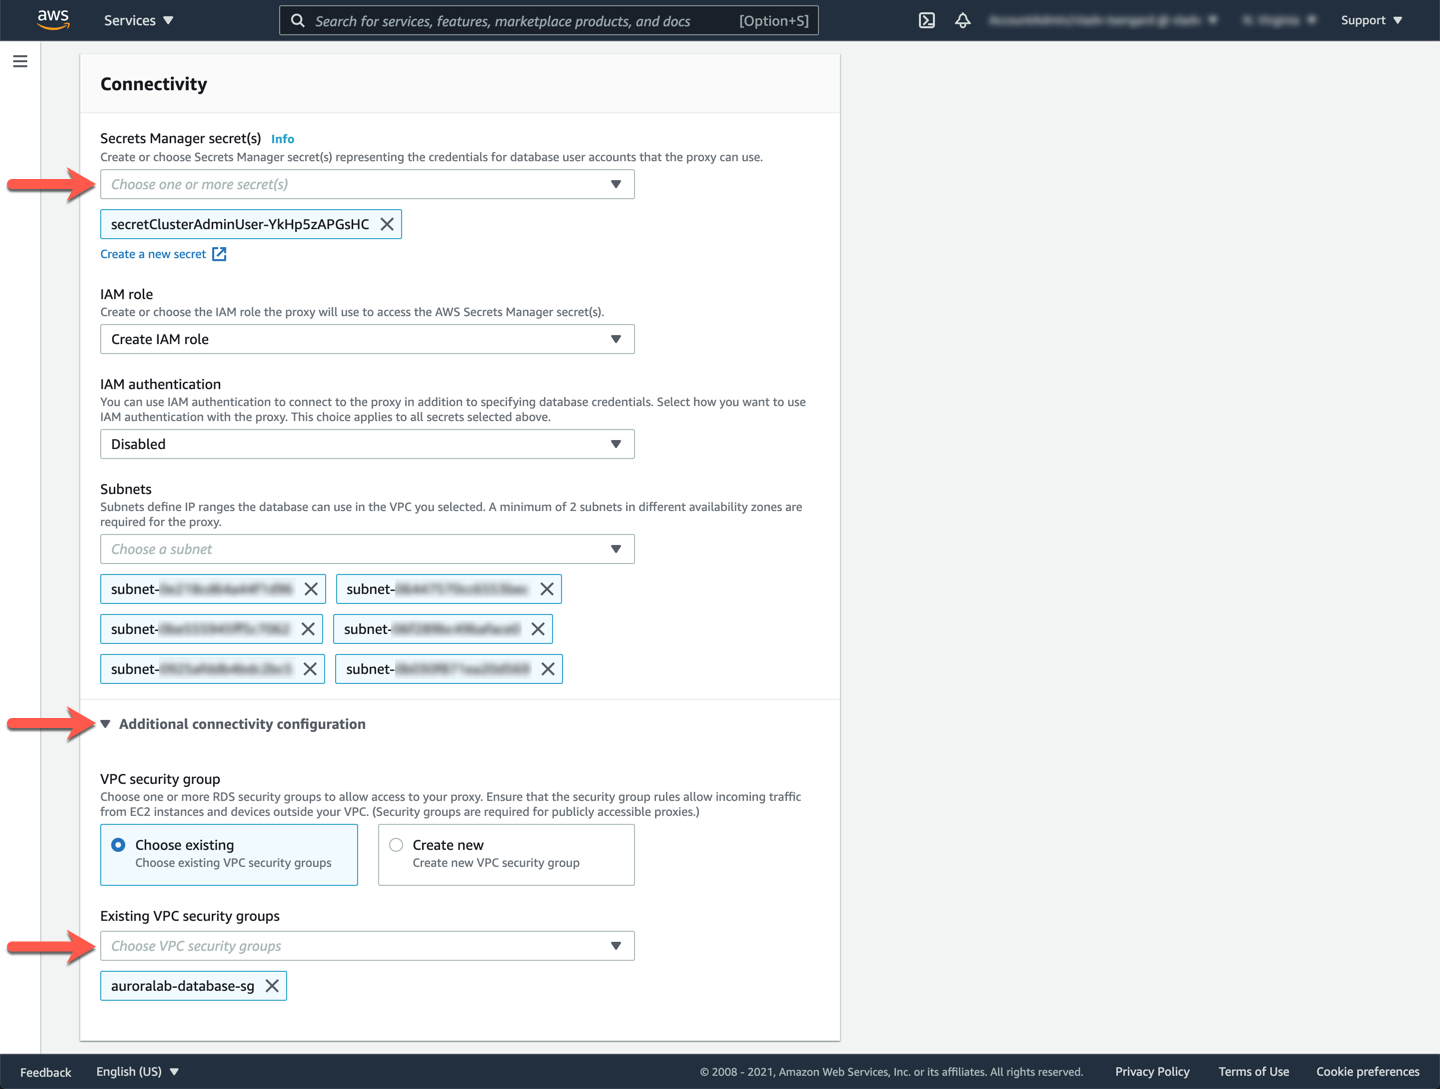
In the **Connectivity** section, in the **Secret Manager secret(s)** dropdown, choose the secret with a name that starts with `secretClusterAdminUser`. In the **IAM role** dropdown, choose the option **Create IAM role**. Expand the **Additional connectivity options** section, and for **Existing VPC security groups** choose `auroralab-database-sg` (de-select the `default` security group).
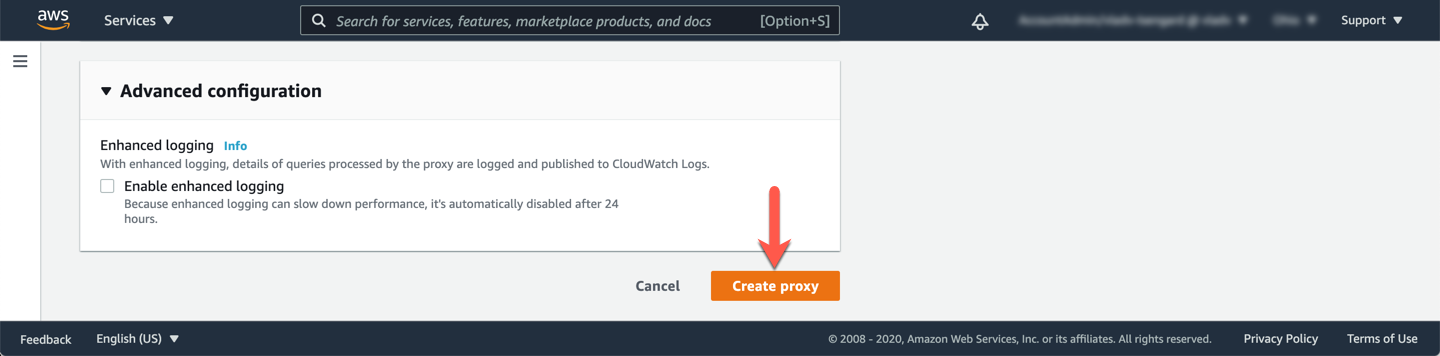
Click **Create proxy**.
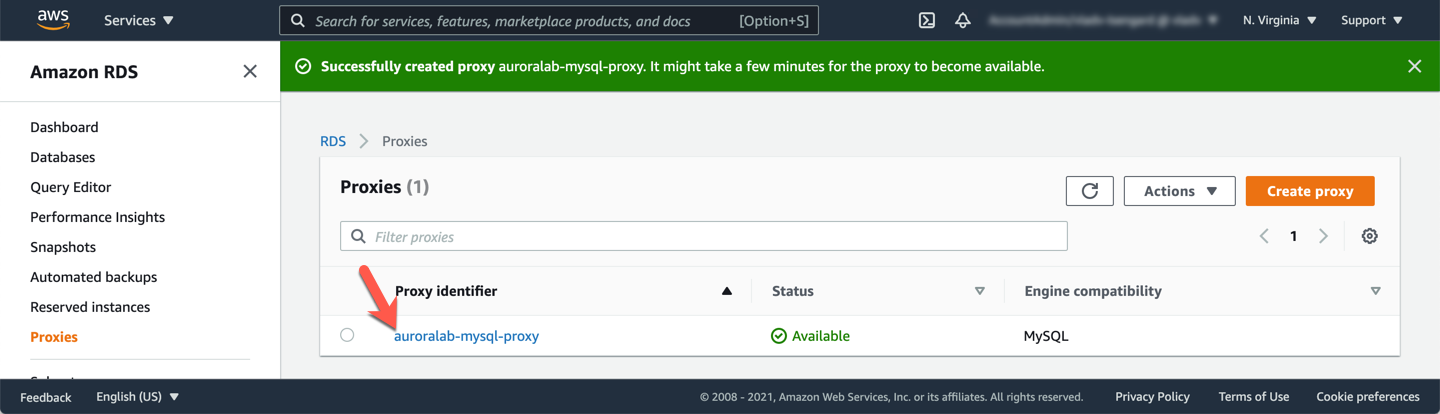
Creating a proxy may take several minutes, you may need to refresh your browser page to view up to date status information. Once the status is listed as **Available**, click on the proxy identifier to view details.
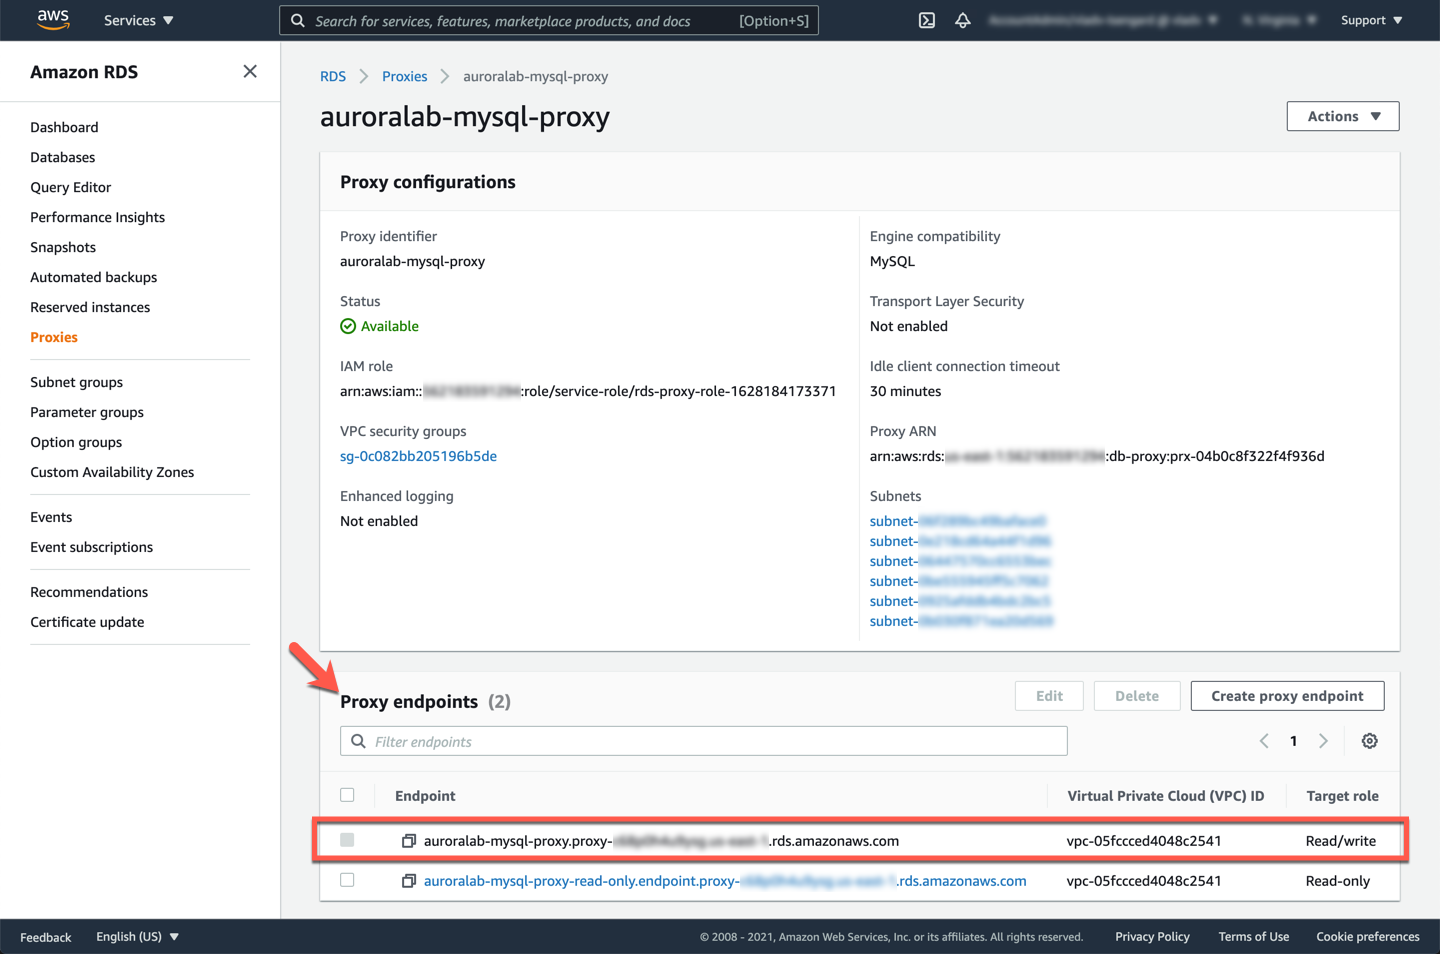
In the **Proxy endpoints** section, locate the endpoint with **Target role** set as `Read/write`. Make a note of it, you will use it later.
Next, you will need two terminal windows open in your Cloud9 desktop. See [Connect to the Cloud9 Desktop](/prereqs/connect/), for steps how to change the layout to have multiple terminal windows side by side, the example below uses a **Horizontal Split** layout.
In one of the two command line sessions, start the monitoring script using the following command:
```
python3 simple_failover.py -e[proxy endpoint from above] -u$DBUSER -p"$DBPASS"
```
You can quit the monitoring script at any time by pressing `Ctrl+C`.
!!! warning "Proxy Endpoint"
Please ensure you use the **Proxy Endpoint** from the previous step, not the cluster endpoint used in the previous labs. If you encounter an error, starting the script, please verify that the endpoint is correct.
In the other command line session, you will trigger a manual failover of the cluster.
Enter the following command in the command line session that does not run the monitoring script:
```
aws rds failover-db-cluster \
--db-cluster-identifier auroralab-mysql-cluster
```
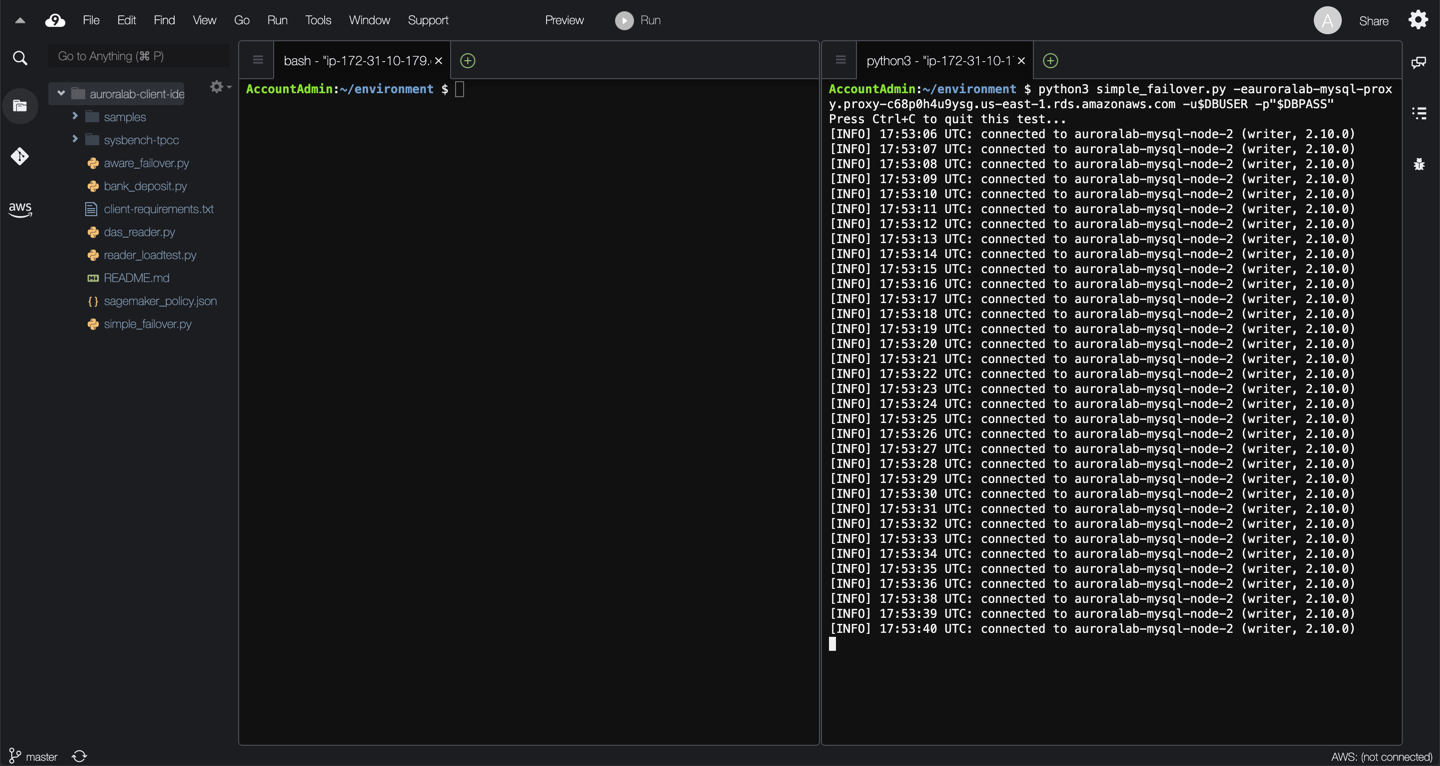
Wait and observe the monitor script output. It can take some time for Amazon Aurora to initiate the failover. Once the failover occurs, you should see monitoring output similar to the example below.
??? info "Observations"
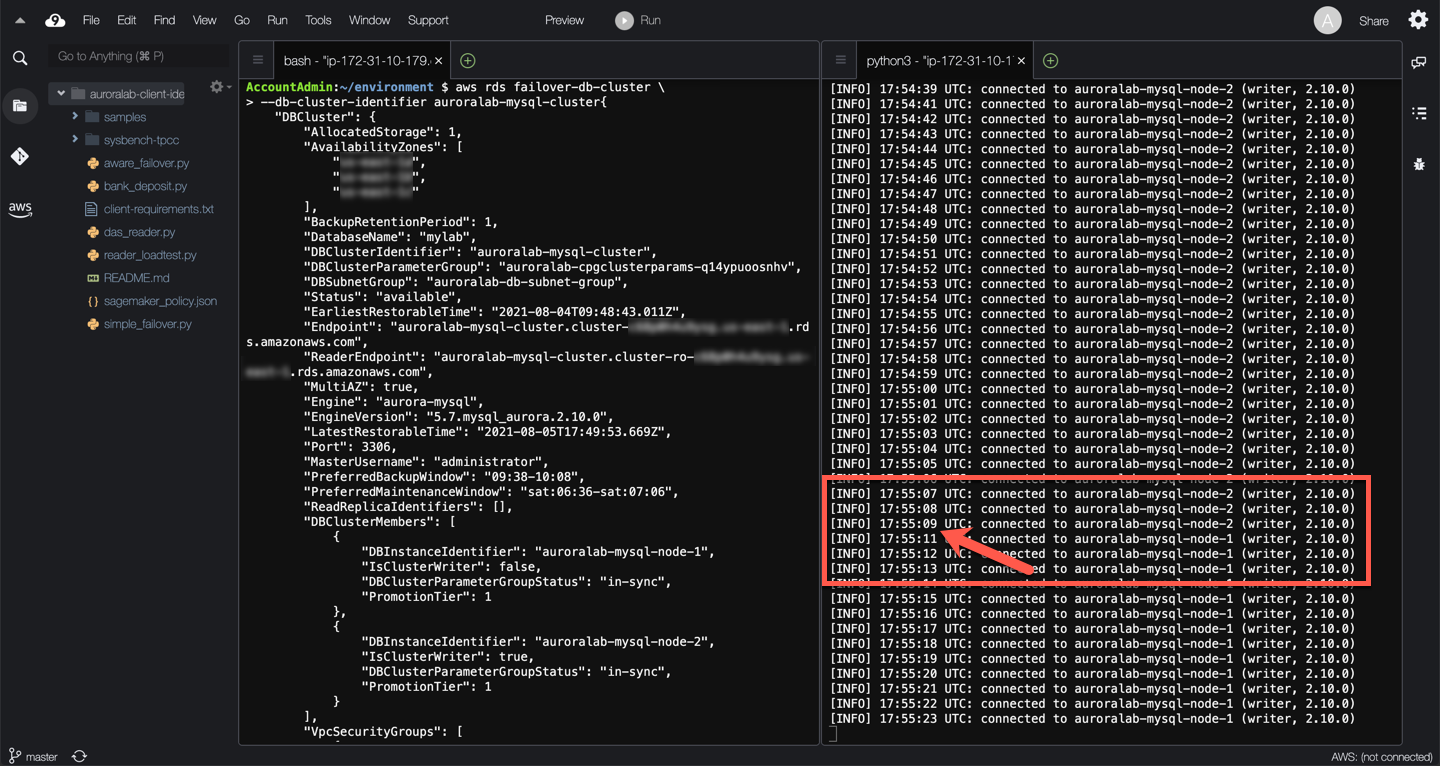
Initially, the proxy sends traffic to the current writer of the DB cluster (`auroralab-mysql-node-2` in the example above). The proxy forwards the monitoring script queries to that particular DB instance.
When the actual failover is implemented by the AWS automation, the proxy holds the client connection open until the failover completes. In this example the script only experiences an additional second of latency to the response, but the response is not provided by the new writer (`auroralab-mysql-node-1` in the example above). In practice, the client experienced ~2 second of latency to the query response.
The timing of requests issued by the client (our monitoring script in this example) matters. If the query is in-flight at the time the failover starts, or you are attempting to establish a new connection while the failover is ongoing, the proxy will return an error so you can retry. Existing client connections with no in-flight queries will be kept open, and any queries received after the failover starts will be queued up at the proxy until the failover completes. Such clients will simply experience increased response latency for the queries issued during the failover.
Feel free to repeat the failover procedure a few times to determine if there are any significant variances.
You will also receive two event notification emails for each failover you initiate, one indicating that a failover has **started**, and one indicating that it has **completed**.
## 6. More testing suggestions
The tests above represent relatively simple failure conditions. Different failure modes may require more advanced testing processes or cluster awareness logic. For more advanced testing, and fault resilience consider the following:
* How would production load at scale affect failure recovery time? Consider testing with the system under load.
* How would recovery time be affected by the workload condition at the time? Consider testing failure recovery during different workload conditions, eg. a crash during a DDL operation.
* Can you improve upon the cluster awareness to address other failure modes?
## 7. Cleanup lab resources
By running this lab, you have created additional AWS resources. We recommend you run the commands below to remove these resources once you have completed this lab, to ensure you do not incur any unwanted charges for using these services.
```
aws rds remove-source-identifier-from-subscription \
--subscription-name auroralab-cluster-failovers \
--source-identifier auroralab-mysql-cluster
aws rds delete-event-subscription \
--subscription-name auroralab-cluster-failovers
aws sns delete-topic \
--topic-arn $(aws sns list-topics --query 'Topics[?contains(TopicArn,`auroralab-cluster-failovers`)].TopicArn' --output text)
aws rds delete-db-proxy \
--db-proxy-name auroralab-mysql-proxy
```