# Analyze SQL Query Performance
This lab will demonstrate how to troubleshoot SQL performance related issues using different tools. More specifically, you will learn how to leverage SQL execution plans, MySQL profiles and the MySQL Performance Schema to analyze queries and determine the cause of performance issues. You will also learn how indexes can help in improving the performance of your queries.
This lab contains the following tasks:
1. Get slow running queries
2. Analyze queries using MySQL's EXPLAIN
3. Profile a query in Aurora MySQL
4. Review available indexes
5. Tune slow queries
6. Review performance
7. Optional: Diagnose issues using the MySQL Performance Schema
8. Optional: Understand the workload using the process list
9. Optional: Diagnose issues with the InnoDB Monitor
10. Optional: Monitor locks using the Information Schema
11. Summary
This lab requires the following prerequisites:
* [Get Started](/prereqs/environment/)
* [Connect to the Cloud9 Desktop](/prereqs/connect/)
* [Create a New DB Cluster](/provisioned/create/) (conditional, only if you plan to create a cluster manually)
* [Connect to the DB Cluster and Load Data](/provisioned/interact/)
* [Observe and Identify SQL Performance Issues](/provisioned/pref-observability/)
## 1. Get slow running queries
In this section, you will learn how to investigate the slow queries (captured in the previous sections) with the help of `EXPLAIN` and `PROFILE`. If you have completed all tasks in the previous lab ([Observe and Identify SQL Performance Issues](/provisioned/pref-observability/)), you should have 3 slow query log files. You can read and identify slow queries from either of them, but for the purposes of this lab, regardless which one you use, it should contain the following queries:
Query ID | Query Text
--- | ---
Q1 | UPDATE weather SET max_temp = 31 WHERE id = 'USC00103882';
Q2 | CALL insert_temp;
Q2a | INSERT INTO weather VALUES ('1993-12-10', '14.38', 'USC00147271', -100.92, 38.47, 21.70, -4.40, 'SCOTT CITY', 'Weak Hot', key_value);
Q2b | DELETE from weather WHERE serialid = key_value;
Q3 | SELECT sql_no_cache max_temp, min_temp, station_name FROM weather WHERE max_temp > 42 AND id = 'USC00103882' ORDER BY max_temp DESC;
Q4 | SELECT sql_no_cache COUNT(id) FROM weather WHERE station_name = 'EAGLE MTN' AND type = 'Weak Cold';
For the purpose of the lab, call this **slow_query_final.log**. You can also go ahead and run the above queries individually on the terminal and see the individual response time.
## 2. Analyze queries using MySQL's EXPLAIN
The EXPLAIN statement provides information about how MySQL executes statements. EXPLAIN works with SELECT, DELETE, INSERT, REPLACE, and UPDATE statements. Your goals are to recognize the aspects of the EXPLAIN plan that indicate a query is optimized well, and to learn the SQL syntax and indexing techniques to improve the plan if you see inefficient processing.
If you have not already opened a terminal window in the Cloud9 desktop in a previous lab, please [following these instructions](/prereqs/connect/) to do so now. Then, connect to the DB cluster endpoint using the MySQL client, if you are not already connected after completing the previous lab, by running:
```
mysql -h[clusterEndpoint] -u$DBUSER -p"$DBPASS" mylab
```
Once connected to the database, capture the EXPLAIN plan for the above slow queries using syntax:
Go ahead and capture the EXPLAIN plan for the above slow queries using syntax
```
EXPLAIN [query statement]
```
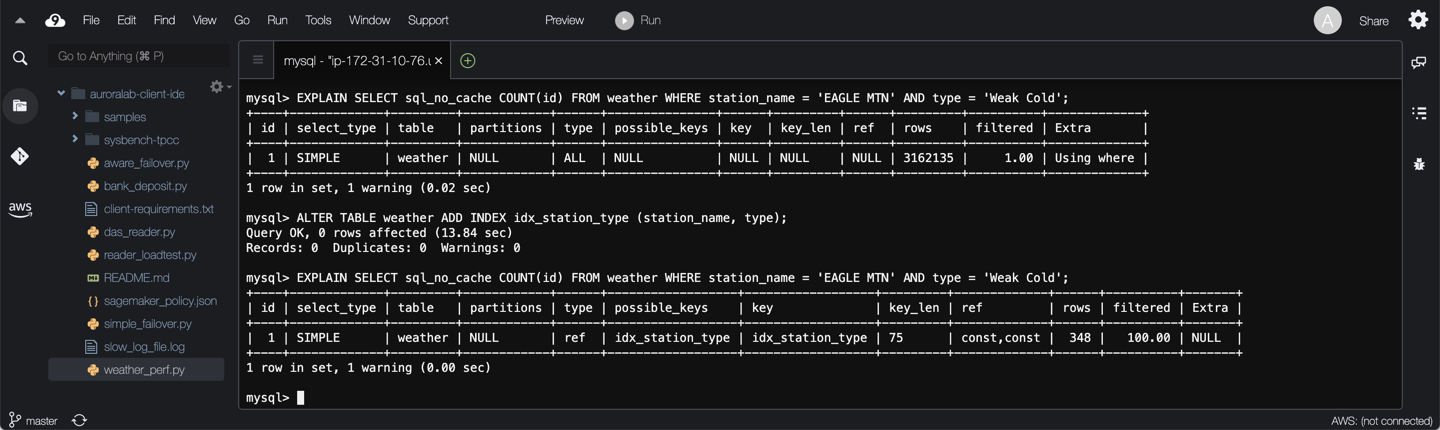
Below is an explain plan for query **Q4**:
```
EXPLAIN SELECT sql_no_cache COUNT(id) FROM weather WHERE station_name = 'EAGLE MTN' AND type = 'Weak Cold';
```
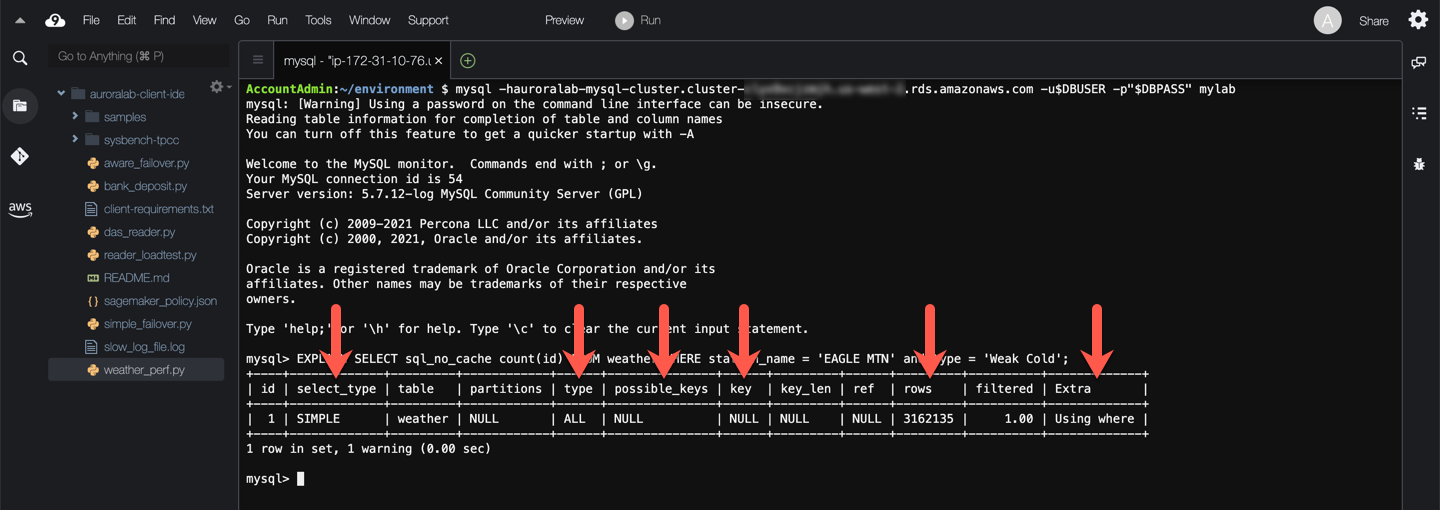
The explain plan has multiple fields and the most common ones to look for are:
* The `type` field proves that database would need to perform a full table scan to run the query. It would need to consider `ALL` rows.
* Fields `possible_keys` and `key` indicate that the table does not contain indexes that could be used during query execution.
* The `rows` field shows the number of rows to be scanned (over 3 million in this case).
* Rows were retrieved from the storage engine (InnoDB) and matched by the database engine itself against the predicates. This is indicated by the clause `Using where` in the `Extra` field. No storage engine optimizations were used to filter rows before they were presented to the database engine.
In this example, the estimation of `rows to be scanned` is very high and there are no keys present in this query. The database engine will process all rows to find the matching ones. Thus processing this query will be slow. You will arrive to similar conclusions for the other slow queries identified.
!!! note "Using EXPLAIN as json"
You can also use `EXPLAIN [...] FORMAT=json` if you are interested in understanding how subqueries are materialized.
## 3. Profile a query in Aurora MySQL
To investigate where these slow queries are is spending their time, you can leverage the MySQL Query Profiling feature. There are currently two ways in MySQL to generate query profiles, one of them is being deprecated. Toggle betwene the tabs below to check out both:
=== "**Using the Performance Schema**"
The following example demonstrates how to use MySQL's Performance Schema statement events and stage events to retrieve query profiles.
!!! tip "More about the Performance Schema"
You can learn more about how to use the Performance Schema at the bottom of this exercise.
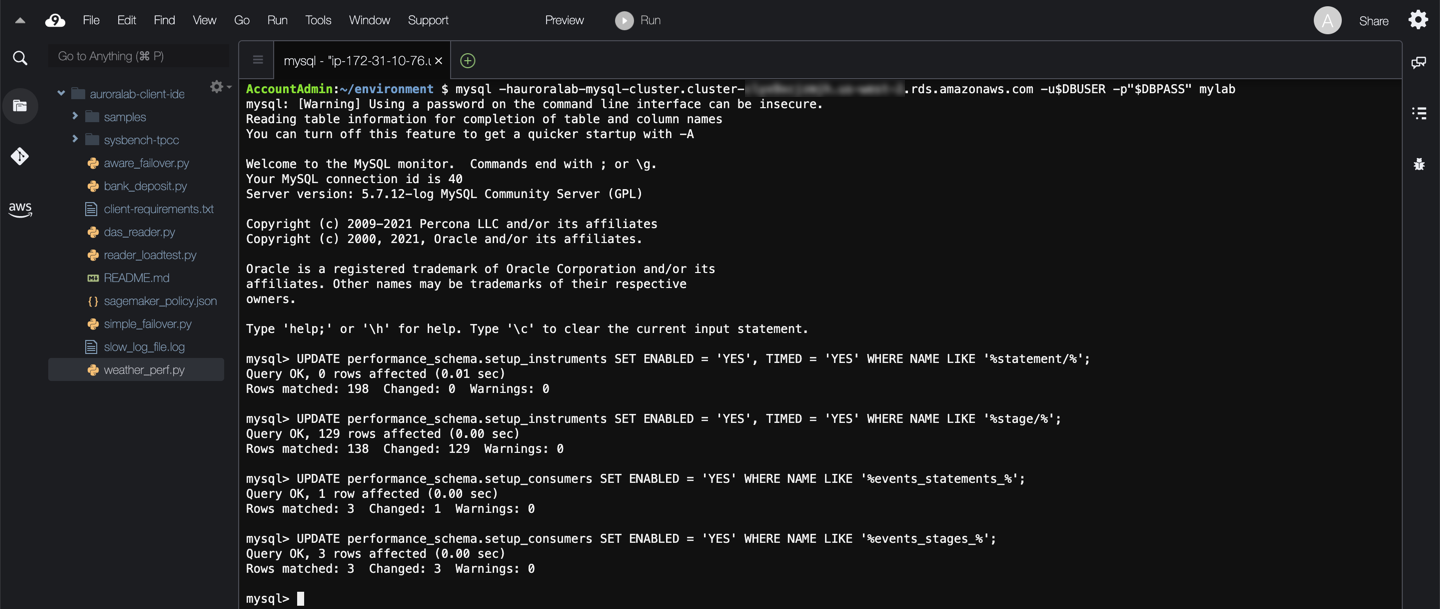
Ensure that `statement` and `stage` instrumentation is enabled by updating the `setup_instruments` table. Some instruments may already be enabled by default. Also, ensure that `events_statements_` and `events_stages_` consumers are enabled. Some consumers may already be enabled by default.
UPDATE performance_schema.setup_instruments SET ENABLED = 'YES', TIMED = 'YES' WHERE NAME LIKE '%statement/%';
UPDATE performance_schema.setup_instruments SET ENABLED = 'YES', TIMED = 'YES' WHERE NAME LIKE '%stage/%';
UPDATE performance_schema.setup_consumers SET ENABLED = 'YES' WHERE NAME LIKE '%events_statements_%';
UPDATE performance_schema.setup_consumers SET ENABLED = 'YES' WHERE NAME LIKE '%events_stages_%';
Run the slow query statement that you want to profile. Below is the process for query **Q4**:
SELECT sql_no_cache COUNT(id) FROM weather WHERE station_name = 'EAGLE MTN' AND type = 'Weak Cold';
Identify the `EVENT_ID` of the statement by querying the `events_statements_history_long` table:
SELECT EVENT_ID, TRUNCATE(TIMER_WAIT/1000000000000,6) as Duration, SQL_TEXT FROM performance_schema.events_statements_history_long WHERE SQL_TEXT like '%EAGLE MTN%';
Query the `events_stages_history_long` table to retrieve the statement's stage events. Stages are linked to statements using event nesting. Each stage event record has a `NESTING_EVENT_ID` column that contains the `EVENT_ID` of the parent statement. Replace the ==[EventId]== placeholder with the event id from the previous query
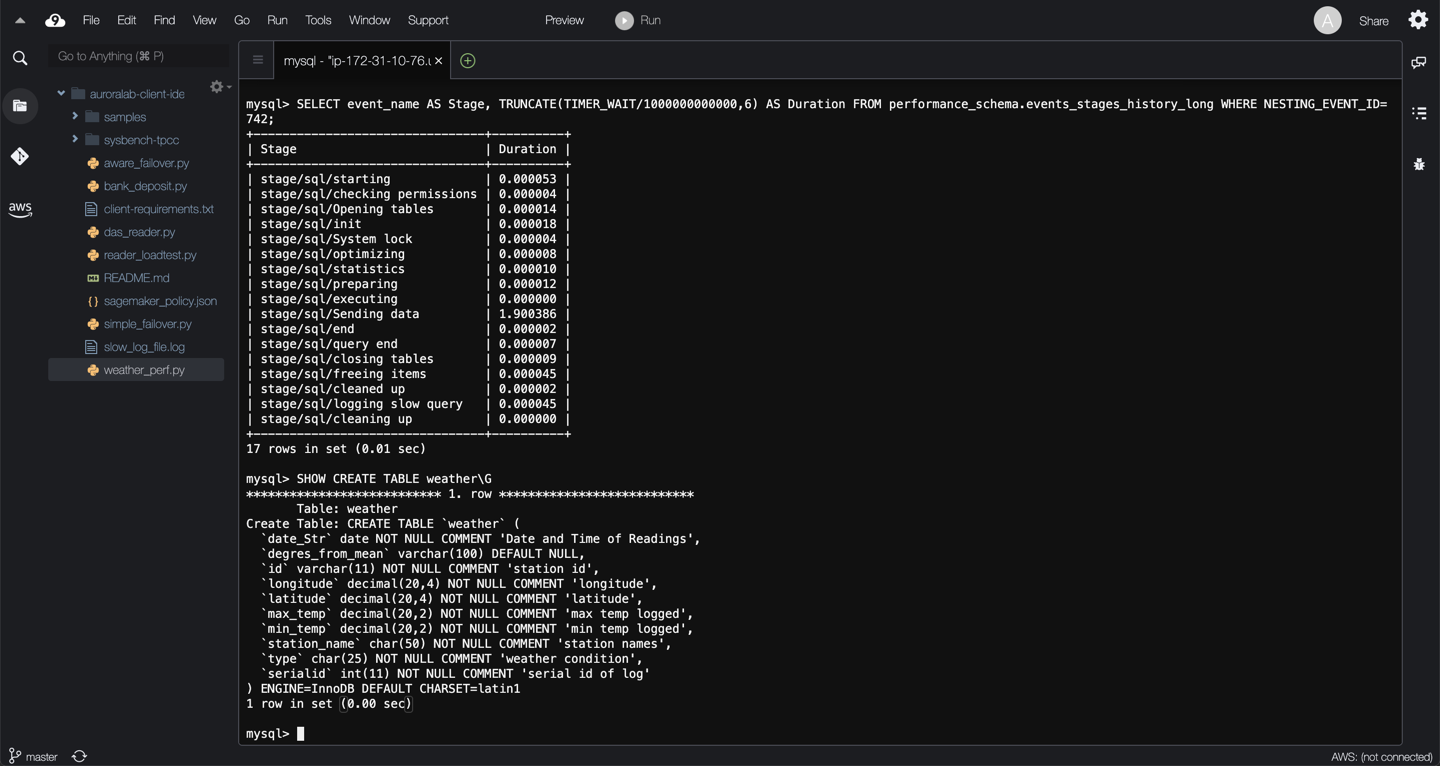
SELECT event_name AS Stage, TRUNCATE(TIMER_WAIT/1000000000000,6) AS Duration FROM performance_schema.events_stages_history_long WHERE NESTING_EVENT_ID=[EventId];
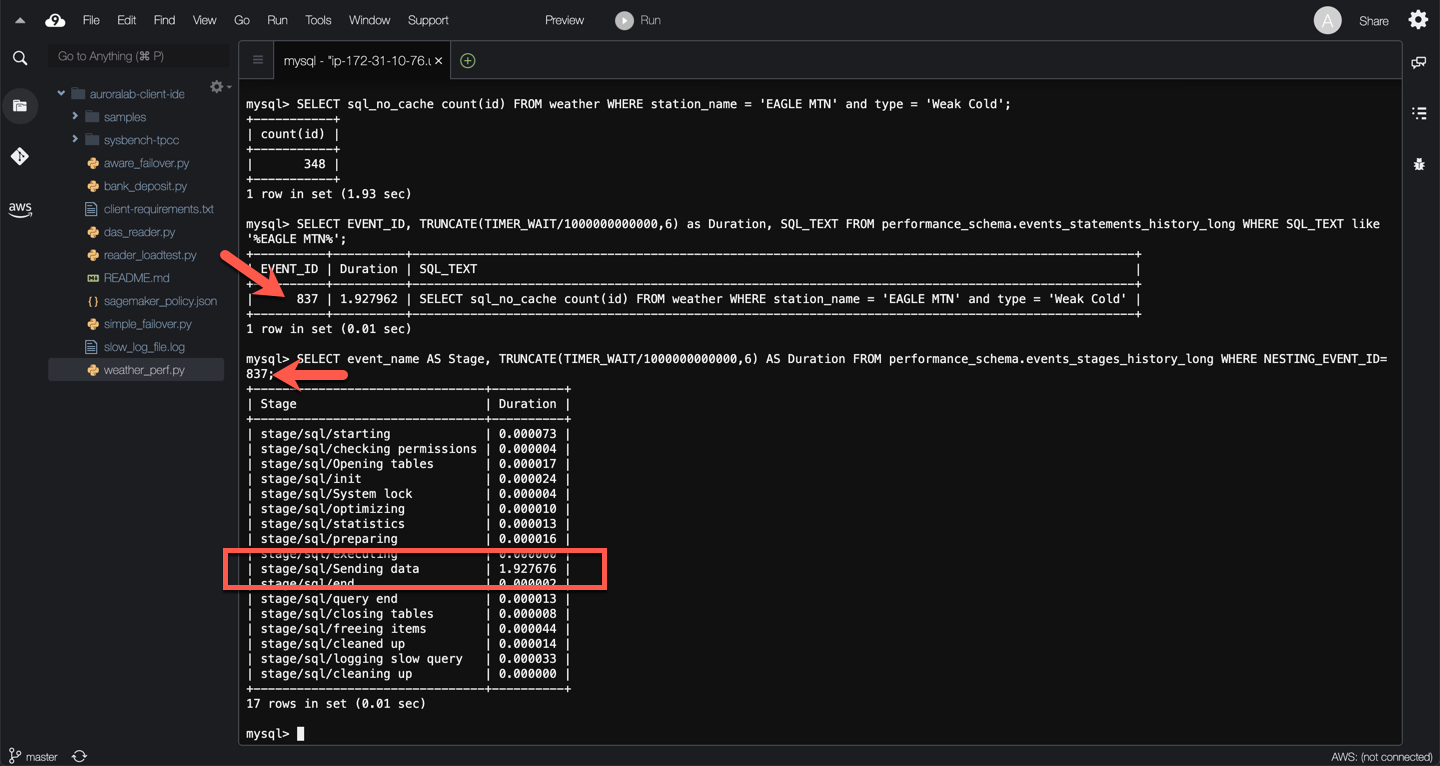
In this example, the query is spending time on `stage/sq/Sending data`. This means, the thread processing the query is reading rows from the storage engine, and sending data to the client if appropriate. Because operations occurring during this state tend to perform large amounts of disk I/O, it is often the longest-running state over the lifetime of a given query. So why does this query need to perform so many reads?
??? tip "Refresh performance_schema counters"
The `setup_actors` table can be used to limit the collection of historical events by host, user, or account to reduce runtime overhead and the amount of data collected in history tables. If you want fresh counters you can truncate and start the collection again like below:
TRUNCATE performance_schema.events_stages_history_long;
TRUNCATE performance_schema.events_statements_history_long;
=== "**Using SHOW PROFILE (Deprecated)**"
The SHOW PROFILE and SHOW PROFILES commands display profiling information that indicates resource usage for statements executed during the course of the current session. Even though the same information can be obtained using MySQL's Performance Schema, this tool is widely used due to the simplicity of operating it. However, these commands are deprecated, and will be removed in a future version of MySQL.
You can use this sequence of commands to profile any of the slow queries identified above. Below is the process for query **Q4**:
SET profiling = 1;
SELECT sql_no_cache COUNT(id) FROM weather WHERE station_name = 'EAGLE MTN' AND type = 'Weak Cold';
SHOW PROFILES;
SHOW PROFILE FOR QUERY 1;
SET profiling = 0;
The resulting output should look like the example below.
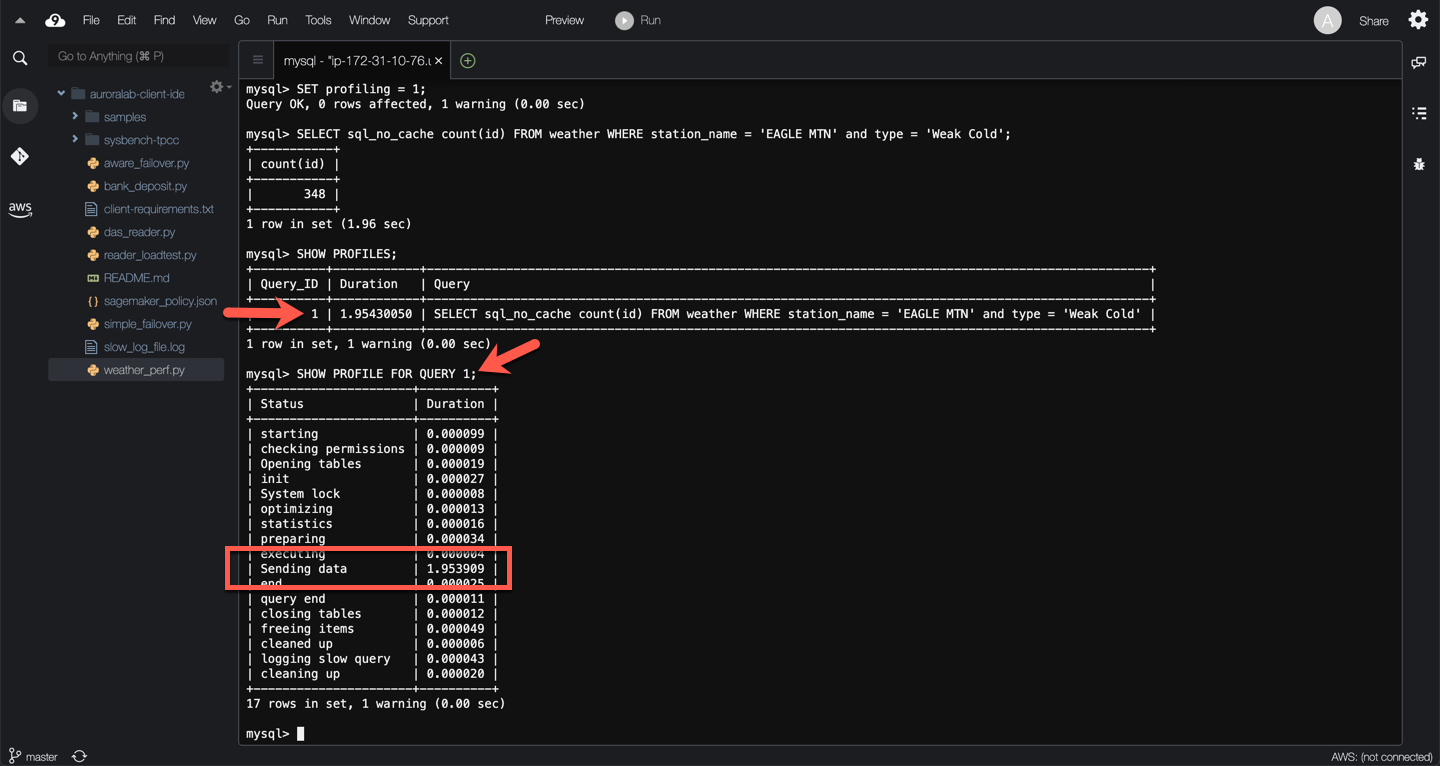
In this example, the query is spending time on `Sending data`. This means, the thread processing the query is reading rows from the storage engine, and sending data to the client if appropriate. Because operations occurring during this state tend to perform large amounts of disk I/O, it is often the longest-running state over the lifetime of a given query. So why does this query need to perform so many reads?
## 4. Review available indexes
Indexes in general help queries to improve the read performance and so its imperative to find out the presence of indexes of the given schema in question. The use of indexes to assist with large blocks of tables, data may have considerable impact on reducing MySQL query execution and, thus, overall processing overhead. Without indexes, the MySQL engine must search the table from start to end, in an operation called a **Scan**. This may have little impact when working with small tables, but may dramatically affect processing time for larger tables.
YOu can check the presence of indexes on a table using one of the methods below:
=== "Using SHOW CREATE TABLE"
You can check the data definition language (DDL) construct of the table to see if it has any indexes using the command below:
SHOW CREATE TABLE weather\G
=== "Using SHOW INDEX"
You can list the indexes for a given table using the command below:
SHOW INDEX FROM weather\G
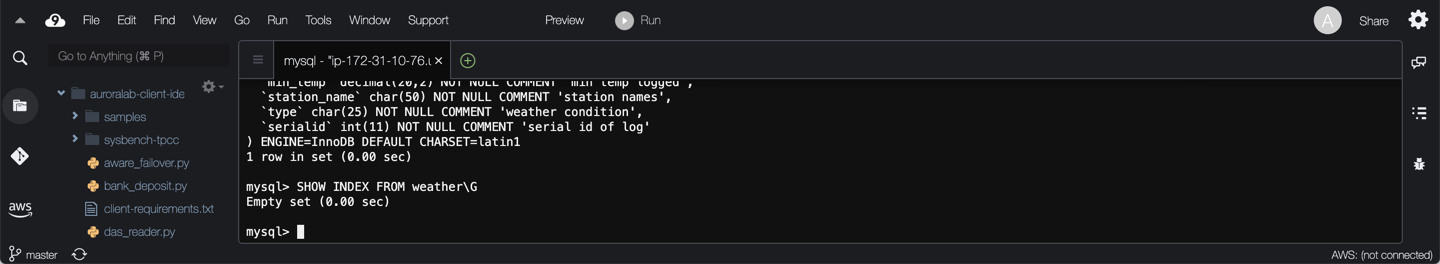
You can see the table does not have any keys or indexes, as a result all queries will scan the table, resulting in performance degradation.
## 5. Tune slow queries
In real world scenarios, based on the type of wait events, schemas, resource utilization the tuning approach will vary. There are many ways to take appropriate corrective actions, such as: tuning the server parameters, re-writing a query, tuning the database schemas or even optimizing the application code.
??? warning "Production Disclaimer"
Since this is a lab environment, you have more flexibility to add indexes on the schema for tuning exercises, as no modifications are required to applications or the queries they issue. However, in real world scenarios, each use case differs and therefore it is essential to fully understand the columns and their purpose, and how your business logic is going to use them before adding indexes. Always test the changes on test/staging environments before applying to production environments.
For the purposes of this task, you will optimize query **Q1**, but the same process applies to any of the other slow queries. Run the query, then explore the execution plan (`EXPLAIN [...]`):
In this section, we'll take the queries from the `slow_query_final.log` and use `EXPLAIN` plan to understand the bottleneck and how to fix them. We will also compare the `execution plans` before and after fixing queries.
```
UPDATE weather SET max_temp = 10.00 WHERE id = 'USC00103882';
EXPLAIN UPDATE weather SET max_temp = 10.00 WHERE id = 'USC00103882';
```
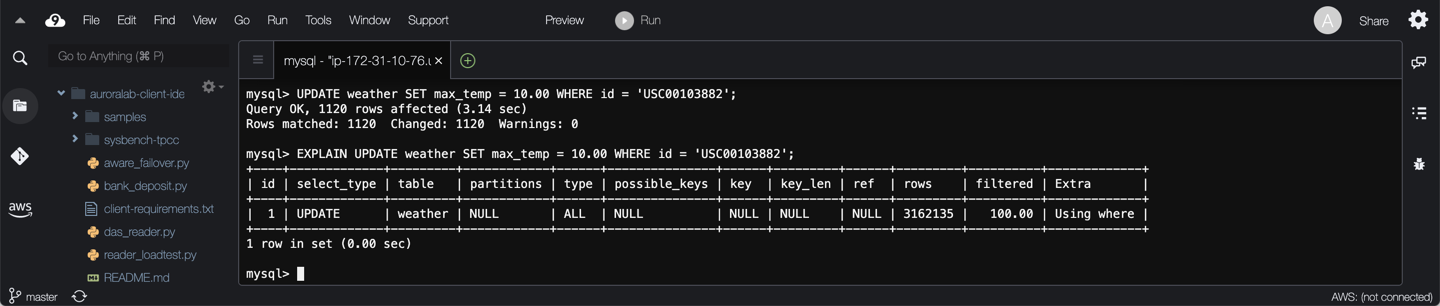
From this, you can see the table is being scanned due to lack of keys, and the number of rows scanned is large. Add an index on the `id` column, check the execution plan of the query again, and run the query again:
```
ALTER TABLE weather ADD INDEX idx_id (id);
EXPLAIN UPDATE weather SET max_temp = 10.00 WHERE id = 'USC00103882';
UPDATE weather SET max_temp = 10.00 WHERE id = 'USC00103882';
```
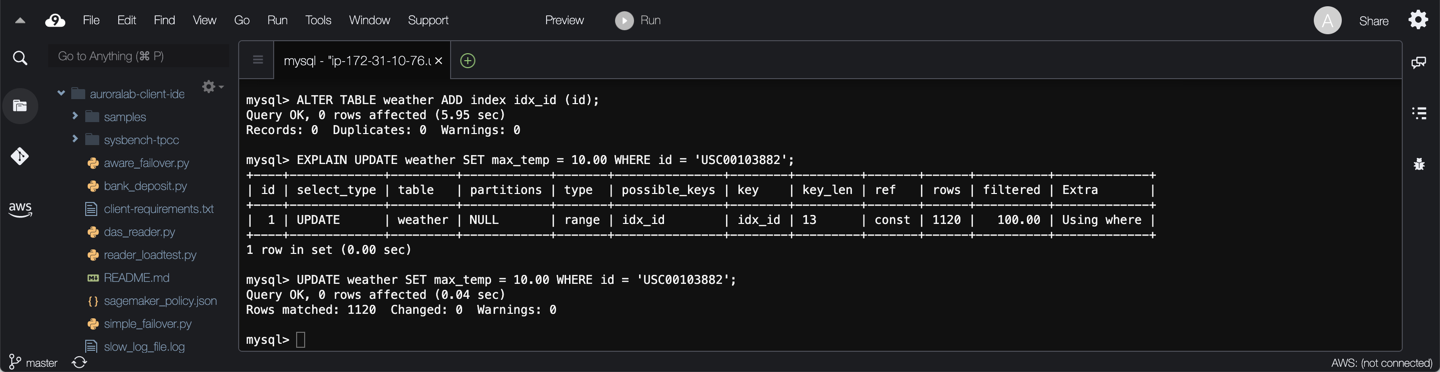
The query is using the newly created index `idx_id` and the number of rows examined is drastically reduced from over 3 million to a little over 1000. As expected the performance of the query has also drastically improved.
In query **Q4**, you can see `station_name` and `type` is used for filtering the results. Multiple-column indexes (composite indexes) with up to 16 columns can be used for queries that have multiple predicates.
Indexes are evaluated **from left to right**, and Aurora MySQL (and any other MySQL-based engine) will only select one index to use for each query execution stage. You cannot use both a single-column index on `station_name` and a single-column index on `type` to optimize query Q4 at the same time. In most cases, it is best practice for the highest cardinality columns to be the left-most members of the index. In query Q4, `station_name` has a higher cardinality than `type`. It thus makes sense to create an index on `station_name + type` rather than `type + station_name`.
Create a composite index for the `station_name` and `type` columns on table `weather` for query Q4, and compare the execution plan before and after adding the index:
```
EXPLAIN SELECT sql_no_cache COUNT(id) FROM weather WHERE station_name = 'EAGLE MTN' AND type = 'Weak Cold';
ALTER TABLE weather ADD INDEX idx_station_type (station_name, type);
EXPLAIN SELECT sql_no_cache COUNT(id) FROM weather WHERE station_name = 'EAGLE MTN' AND type = 'Weak Cold';
```
By adding different indexes you can observe that all slow queries identified show a performance benefit.
You can now also revisit the query profiles to see that the added indexes have changed the execution profile timings as well. Follow the same steps as in task **2. Profile a query in Aurora MySQL** above to generate the query profiles. The example below illustrates the change for query Q4 using the Performance Schema:
In both cases, the query spends less processing time in the `stage/sql/Sending data` stage compared to the earlier profiles, as it is accessing *less* rows.
## 6. Review performance
After adding the indexes, you should re-run the workload in the previous lab and compare the performance of the workload before and after. Before starting the workload truncate the performance schema tables to have fresh counters, this will simplify the comparison.
First, exit out of the MyQL client, if you are still connected using:
```
quit;
```
Please run the following command to generate a [sample workload](/scripts/weather_perf.py), replacing the ==[clusterEndpoint]== placeholder with the cluster endpoint of your DB cluster.
```
python3 weather_perf.py -e[clusterEndpoint] -u$DBUSER -p"$DBPASS" -dmylab
```
Whereas in the previous lab the script took ~4 - 5 minutes to complete, it now completes in less than 1 minute.
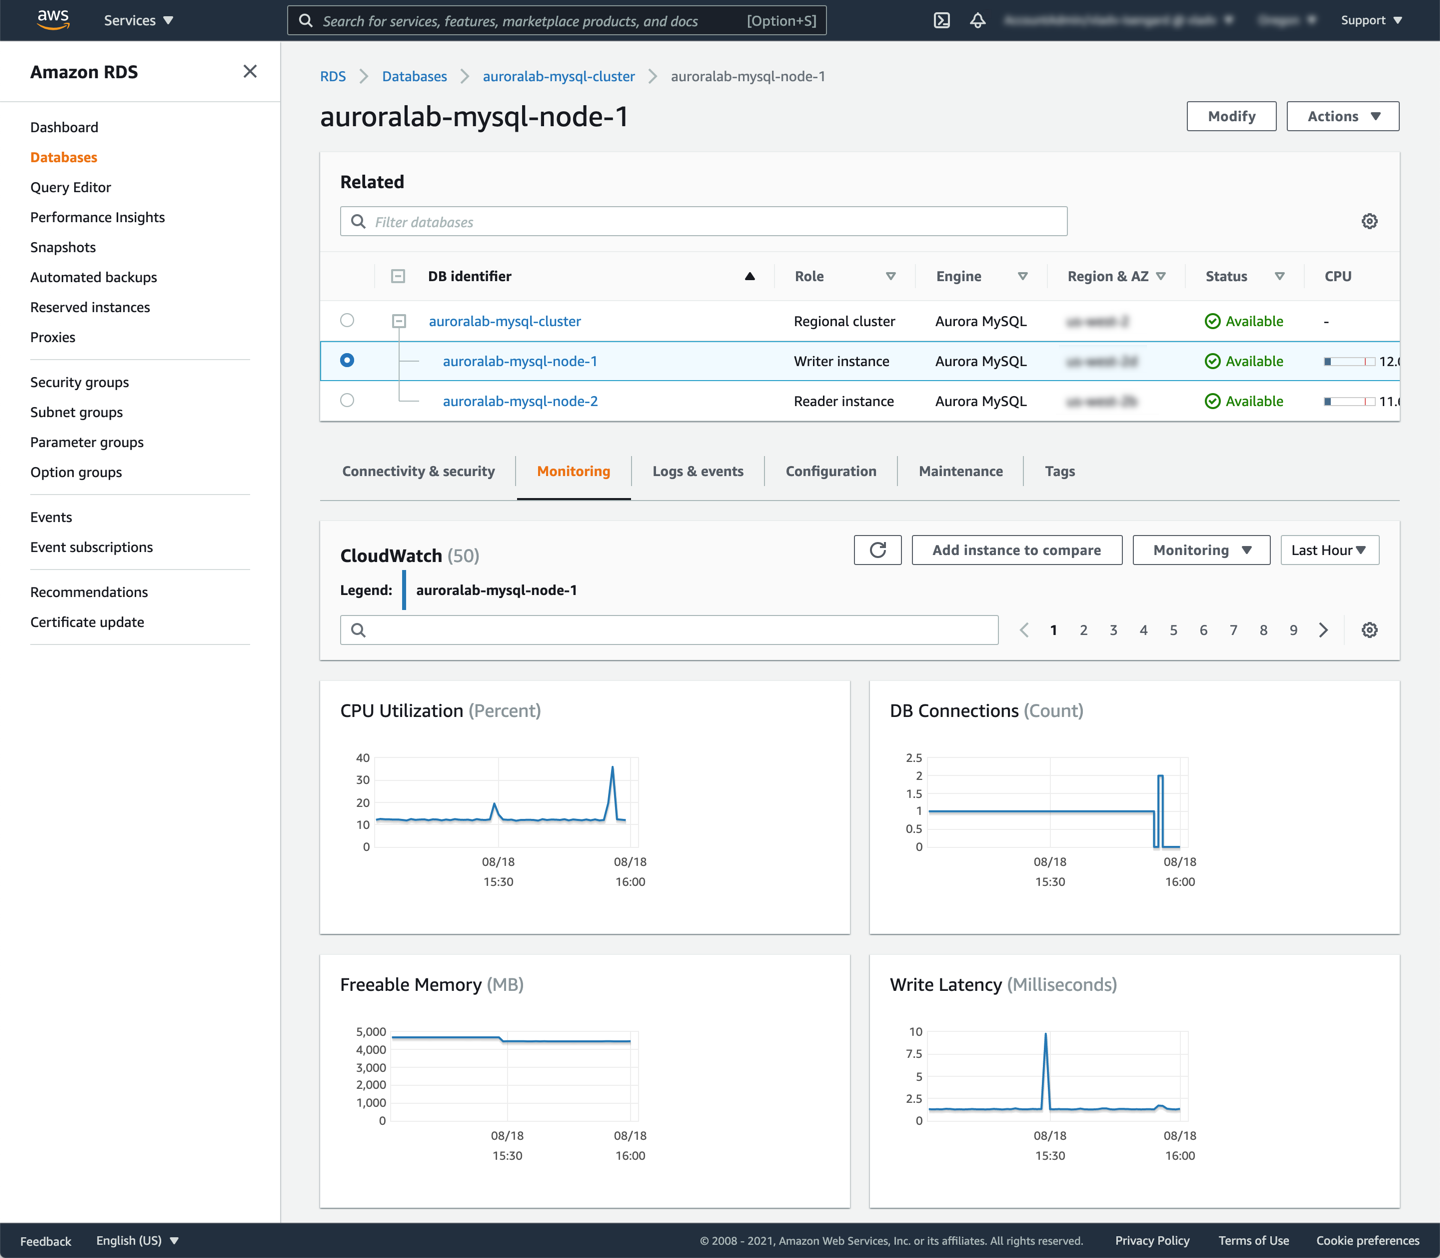
Review the CloudWatch Metrics, by opening the Amazon RDS service console at the DB cluster details page in a new tab, if not already open. Find the DB instance in the cluster that has the **Writer instance** role and click on the name, to view the DB instance CloudWatch metrics. Note there are no longer any large spikes saturating the compute capacity in the metrics, compared to the previous lab.
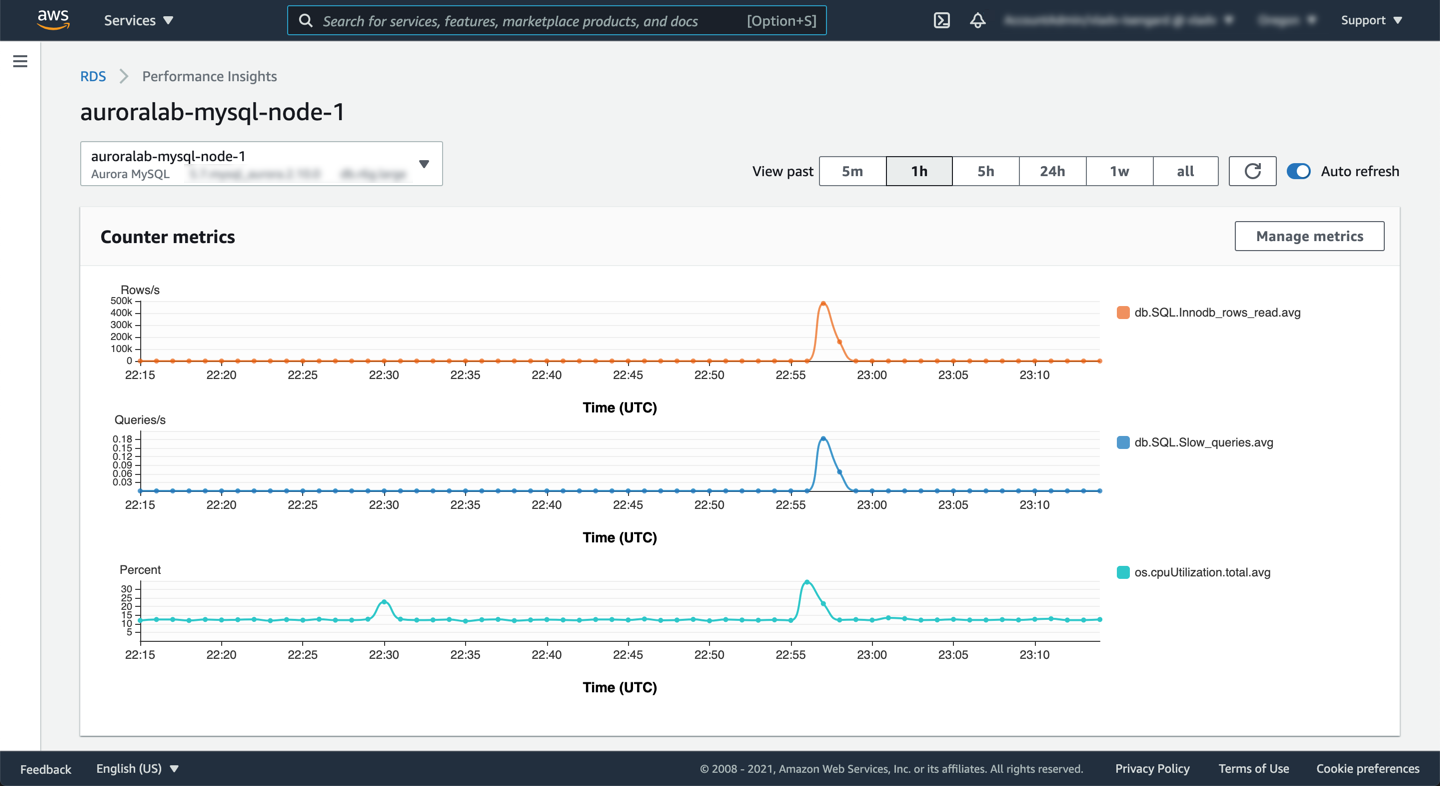
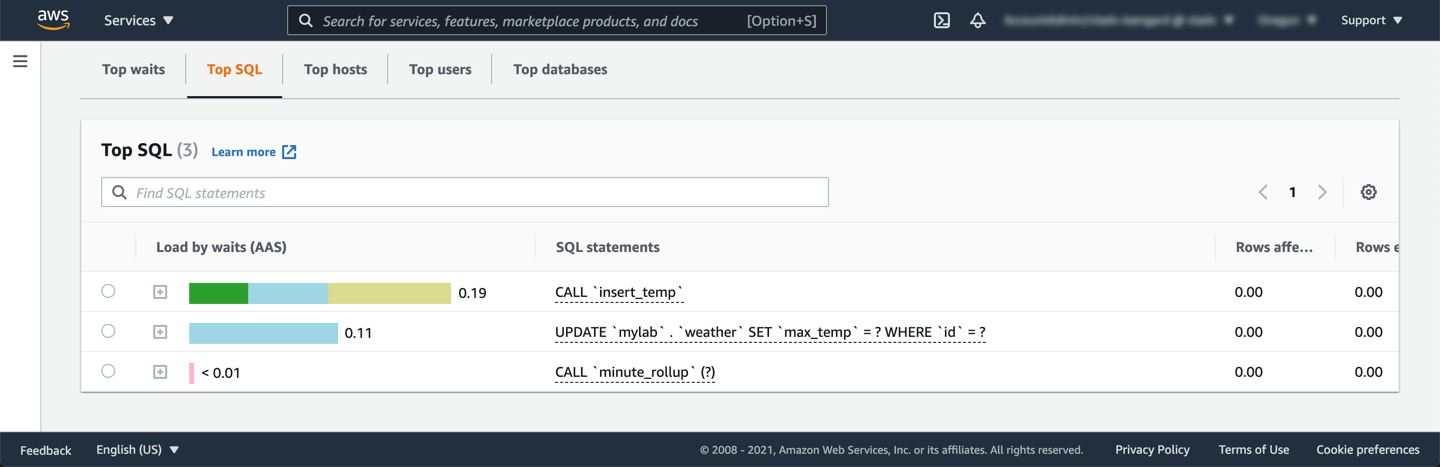
Open the Performance Insights dashboard for the writer instance by clicking the **Monitoring** dropdown button and choosing **Performance Insights**. The **Counter metrics** also reflects a reduction in load, with reduced CPU utilization and number of InnDB rows read.
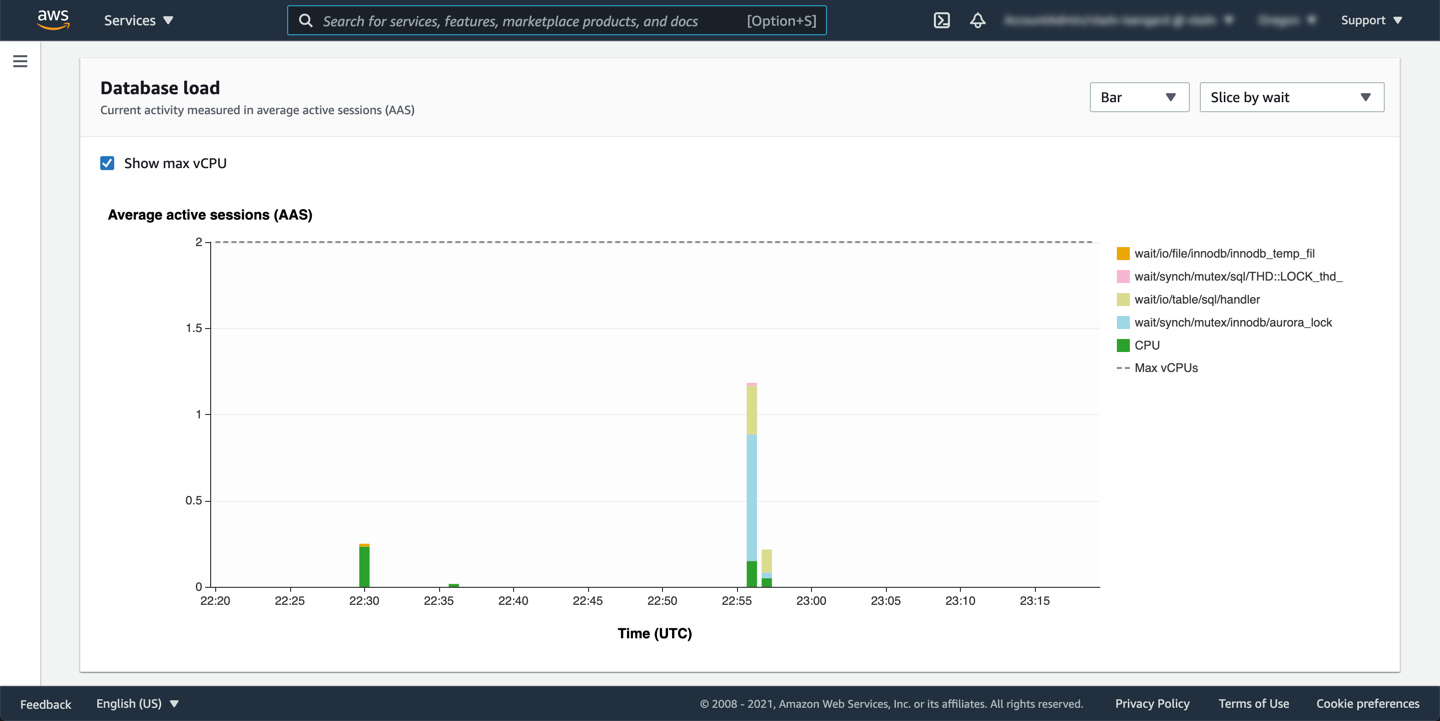
In the previous lab, the aggregate load was exceeding the `max vCPUs` treshold, however now the execution was faster and there is no bottleneck on the CPU. This also means the solution worked without scaling up the DB instance class (compute capacity).
From the **Top SQL** queries, the queries which appeared before adding indexes are not appearing anymore. This indicates that indexes helped those queries in consuming less resources.
## 7. Optional: Diagnose issues using the MySQL Performance Schema
The MySQL Performance Schema (P_S) is an advanced MySQL diagnostic tool for monitoring MySQL servers. The Performance Schema is `disabled` by default, as enabling it will consume additional CPU and memory capacity. However, when Amazon RDS Performance Insights is enabled, the Performance Schema is required to capture the granular performance metrics needed.
In Aurora MySQL, Performance Insights uses the Performance Schema and other global counters to construct the metrics and their visualizations. If you would like to learn how to enable Performance Insights or the Performance Schema, please refer to our [documentation](https://docs.aws.amazon.com/AmazonRDS/latest/AuroraUserGuide/USER_PerfInsights.EnableMySQL.html) for instructions.
The Performance Schema feature works by counting and timing server events, collecting and storing them in memory, and exposing the resulting metrics through a collection of tables in the` performance_schema` database.
!!! note "Note"
Performance Schema tables are kept in memory and their contents will be lost in the event of server reboot.
!!! tip "Fresh counters"
Before every load, to get fresh counters you can consider `TRUNCATE`-ing the performance_schema tables that you want to query.
You can use the following queries on `performance_schema` tables to diagnose workload issues:
**Top 5 wait events:**
```
select event_name as wait_event, count_star as all_occurrences, CONCAT(ROUND(sum_timer_wait / 1000000000000, 2), ' s') as total_wait_time, CONCAT(ROUND(avg_timer_wait / 1000000000000, 2), ' s') as avg_wait_time from performance_schema.events_waits_summary_global_by_event_name where count_star > 0 and event_name <> 'idle' order by sum_timer_wait desc limit 5;
```
**Top 5 statements, ordered by total execution time:**
```
select replace(event_name, 'statement/sql/', '') as statement, count_star as all_occurrences, CONCAT(ROUND(sum_timer_wait / 1000000000000, 2), ' s') as total_latency, CONCAT(ROUND(avg_timer_wait / 1000000000000, 2), ' s') as avg_latency, CONCAT(ROUND(sum_lock_time / 1000000000000, 2), ' s') as total_lock_time, sum_rows_affected as sum_rows_changed, sum_rows_sent as sum_rows_selected, sum_rows_examined as sum_rows_scanned, sum_created_tmp_tables, sum_created_tmp_disk_tables, if(sum_created_tmp_tables = 0, 0, concat(truncate(sum_created_tmp_disk_tables/sum_created_tmp_tables*100, 0))) as tmp_disk_tables_percent, sum_select_scan, sum_no_index_used, sum_no_good_index_used from performance_schema.events_statements_summary_global_by_event_name where event_name like 'statement/sql/%' and count_star > 0 order by sum_timer_wait desc limit 5;
```
**Top 5 queries, order by total execution time:**
```
select digest_text as normalized_query, count_star as all_occurr, CONCAT(ROUND(sum_timer_wait / 1000000000000, 3), ' s') as total_t, CONCAT(ROUND(min_timer_wait / 1000000000000, 3), 's') as min_t, CONCAT(ROUND(max_timer_wait / 1000000000000, 3), ' s') as max_t, CONCAT(ROUND(avg_timer_wait / 1000000000000, 3), ' s') as avg_t, CONCAT(ROUND(sum_lock_time / 1000000000000, 3), ' s') as total_lock_t, sum_rows_affected as sum_rows_changed, sum_rows_sent as sum_rows_selected, sum_rows_examined as sum_rows_scanned, sum_created_tmp_tables, sum_created_tmp_tables, sum_select_scan, sum_no_index_used from performance_schema.events_statements_summary_by_digest where schema_name iS NOT NULL order by sum_timer_wait desc limit 5 ;
```
**Top 5 queries performing full table scans:**
```
SELECT schema_name, substr(digest_text, 1, 100) AS statement, count_star AS cnt, sum_select_scan AS full_table_scan FROM performance_schema.events_statements_summary_by_digest WHERE sum_select_scan > 0 and schema_name iS NOT NULL ORDER BY sum_select_scan desc limit 5;
```
**Top 5 queries for which temporary tables spilled to disk:**
```
SELECT schema_name, substr(digest_text, 1, 100) AS statement,count_star AS cnt, sum_created_tmp_disk_tables AS tmp_disk_tables,sum_created_tmp_tables AS tmp_tables FROM performance_schema.events_statements_summary_by_digest WHERE sum_created_tmp_disk_tables > 0 OR sum_created_tmp_tables >0 and schema_name='mylab' ORDER BY tmp_disk_tables desc limit 5;
```
??? tip "Learn more about statement digests"
To learn more about statement digest aggregation rules please refer to the MySQL documentation.
## 8. Optional: Understand the workload using the process list
To review the workload at a given point in time, you can review the **process list** to see active sessions, including their current state:
```
SHOW PROCESSLIST;
```
## 9. Optional: Diagnose issues with the InnoDB Monitor
To understand transactions running inside the InnoDB storage engine, you can leverage the InnoDB Monitor while connected to the writer instance (DB cluster endpoint). This command exposes outputs from various InnoDB monitors and can be instrumental in understanding the internal state of the InnoDB storage engine. Information returned by the command includes but is not limited to:
* Details of most recently detected deadlocks and foreign key errors,
* Transactions and their activity,
* State of InnoDB memory structures such as the Buffer Pool and Adaptive Hash Index.
!!! note "InnoDB Monitor Access"
Please note in Aurora MySQL, this query works only on writer instances and not on reader instances.
```sql
SHOW ENGINE INNODB STATUS\G
```
The output can be quite long, but will look similar to the examples below:
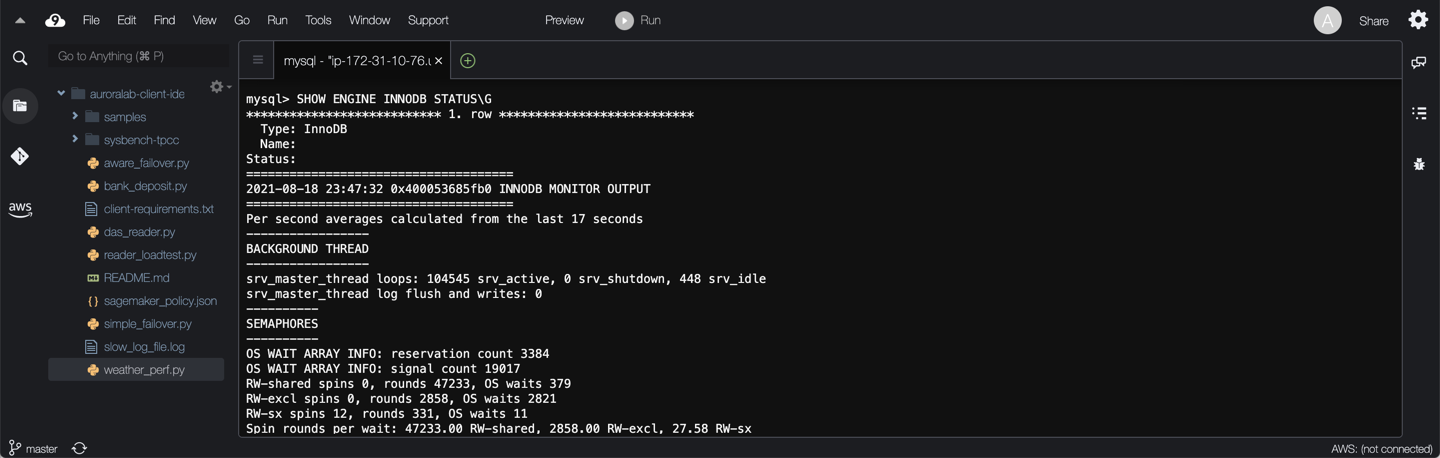
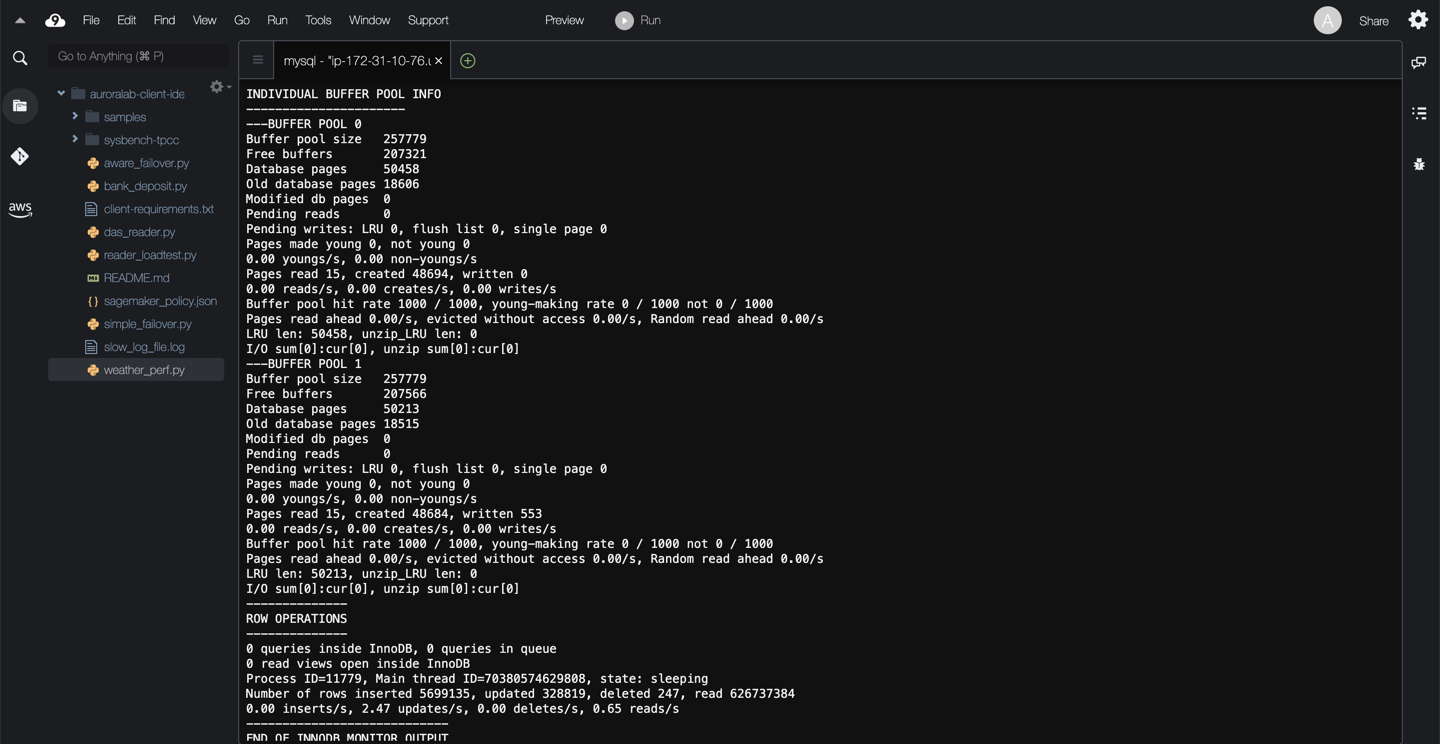
The following sections and data points are included in the output:
* **SEMAPHORES:** Threads waiting for a semaphore and stats on how the number of times threads have needed a spin or a wait on a mutex or rw-lock semaphore. If this number of threads is large, there may be I/O or contention issues. Reducing the size of the innodb_thread_concurrency system variable may help if contention is related to thread scheduling. Spin rounds per wait shows the number of spinlock rounds per OS wait for a mutex.
* **LATEST FOREIGN KEY ERROR:** Only shown if there has been a foreign key constraint error, it displays the failed statement and information about the constraint and the related tables.
* **LATEST DETECTED DEADLOCK:** Only shown if there has been a deadlock, it displays the transactions involved in the deadlock and the statements being executed, held and required locked and the transaction rolled back to.
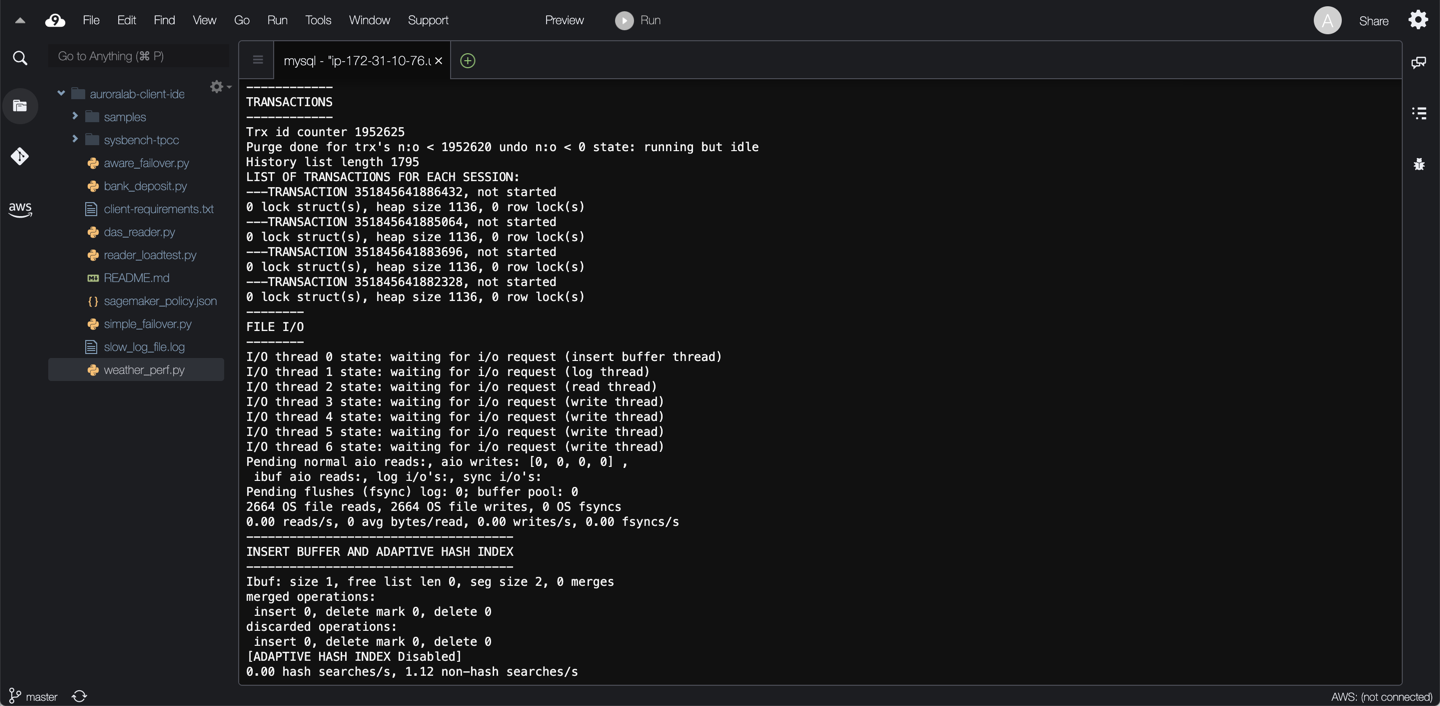
* **History list length:** Unpurged old row versions from undo logs.
* **TRANSACTIONS:** The output of this section can help identify lock contention, as well as reasons for the deadlocks.
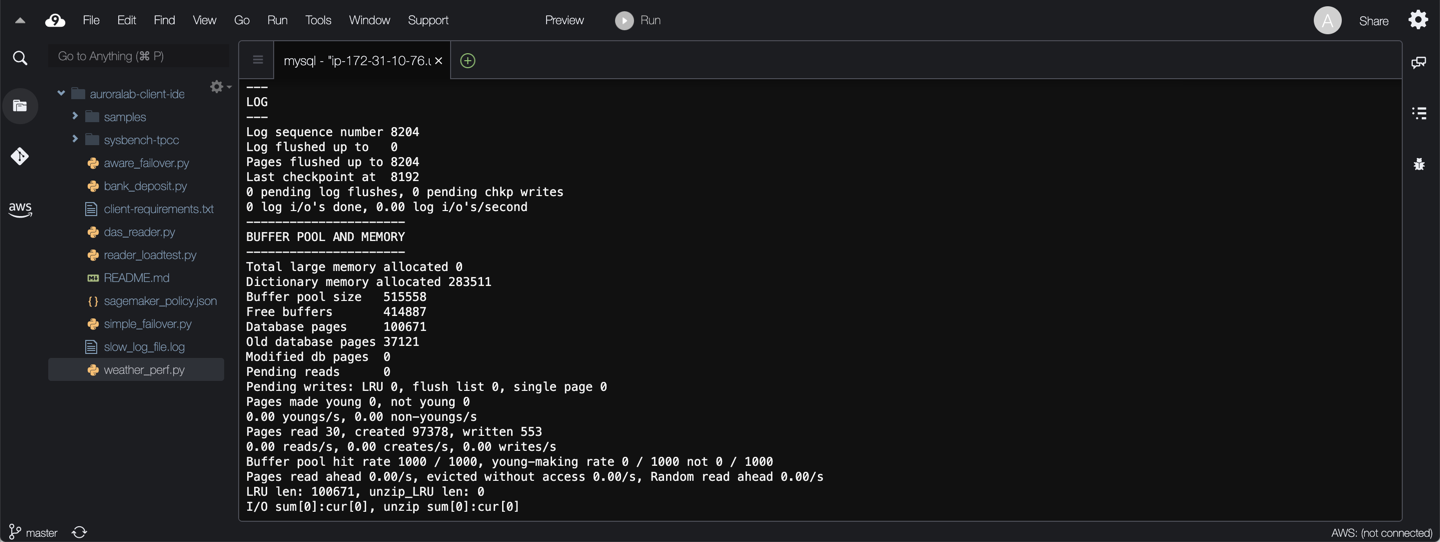
* **BUFFER POOL AND MEMORY:** Information on buffer pool pages read and written, which allows you to see the number of data file I/O operations performed by your queries. See InnoDB Buffer Pool for more. Similar information is also available from the INFORMATION_SCHEMA.INNODB_BUFFER_POOL_STATS table.
* **ROW OPERATIONS:** Information about the main thread, including the number and performance rate for each type of row operation. Would give a snapshot of whether the instance is read or write heavy.
## 10. Optional: Monitor locks using the Information Schema
To understand locking transactions you can query MySQL's `information_schema` using queries such as below:
```
SELECT r.trx_id waiting_trx_id, r.trx_mysql_thread_id waiting_thread, r.trx_query waiting_query, b.trx_id blocking_trx_id, b.trx_mysql_thread_id blocking_thread, b.trx_query blocking_query FROM information_schema.innodb_lock_waits w INNER JOIN information_schema.innodb_trx b ON b.trx_id = w.blocking_trx_id INNER JOIN information_schema.innodb_trx r ON r.trx_id = w.requesting_trx_id;
```
With Aurora, blocking transactions can be monitored through the `BlockedTransactions` and deadlocks through the `Deadlocks` CloudWatch metrics which might be helpful. You can also enable the parameter `innodb_print_all_deadlocks` to have all deadlocks in InnoDB recorded in the Error Log.
## 11. Summary
In this lab you have used:
* MySQL's explain plan and profiling features to analyze slow queries.
* Tuned the schema design by adding indexes to improve the performance without rewriting queries.
* Optionally used the MySQL process list, InnoDB Monitor, and `information_schema` and `performance_schema` tables to understand databsase engine activity.