# Use Performance Insights
This lab will demonstrate the use of Amazon RDS Performance Insights. Amazon RDS Performance Insights monitors your Amazon RDS DB instance load so that you can analyze and troubleshoot your database performance.
This lab contains the following tasks:
1. Generate load on your DB cluster
2. Understand the Performance Insights interface
3. Examine the performance of your DB instance
This lab requires the following prerequisites:
* [Get Started](/prereqs/environment/)
* [Connect to the Cloud9 Desktop](/prereqs/connect/)
* [Create a New DB Cluster](/provisioned/create/) (conditional, only if you plan to create a cluster manually)
## 1. Generate load on your DB cluster
You will use Percona's TPCC-like benchmark script based on sysbench to generate load. For simplicity we have packaged the correct set of commands in an AWS Systems Manager Command Document. You will use AWS Systems Manager Run Command to execute the test.
If you have not already opened a terminal window in the Cloud9 desktop in a previous lab, please [following these instructions](/prereqs/connect/) to do so now. Once connected, choose the tab below that best matches your circumstances, and run the indicated commands:
=== "The DB cluster has been pre-created for me"
If AWS CloudFormation has provisioned the DB cluster on your behalf, and you skipped the **Create a New DB Cluster** lab, you can run the simplified command below:
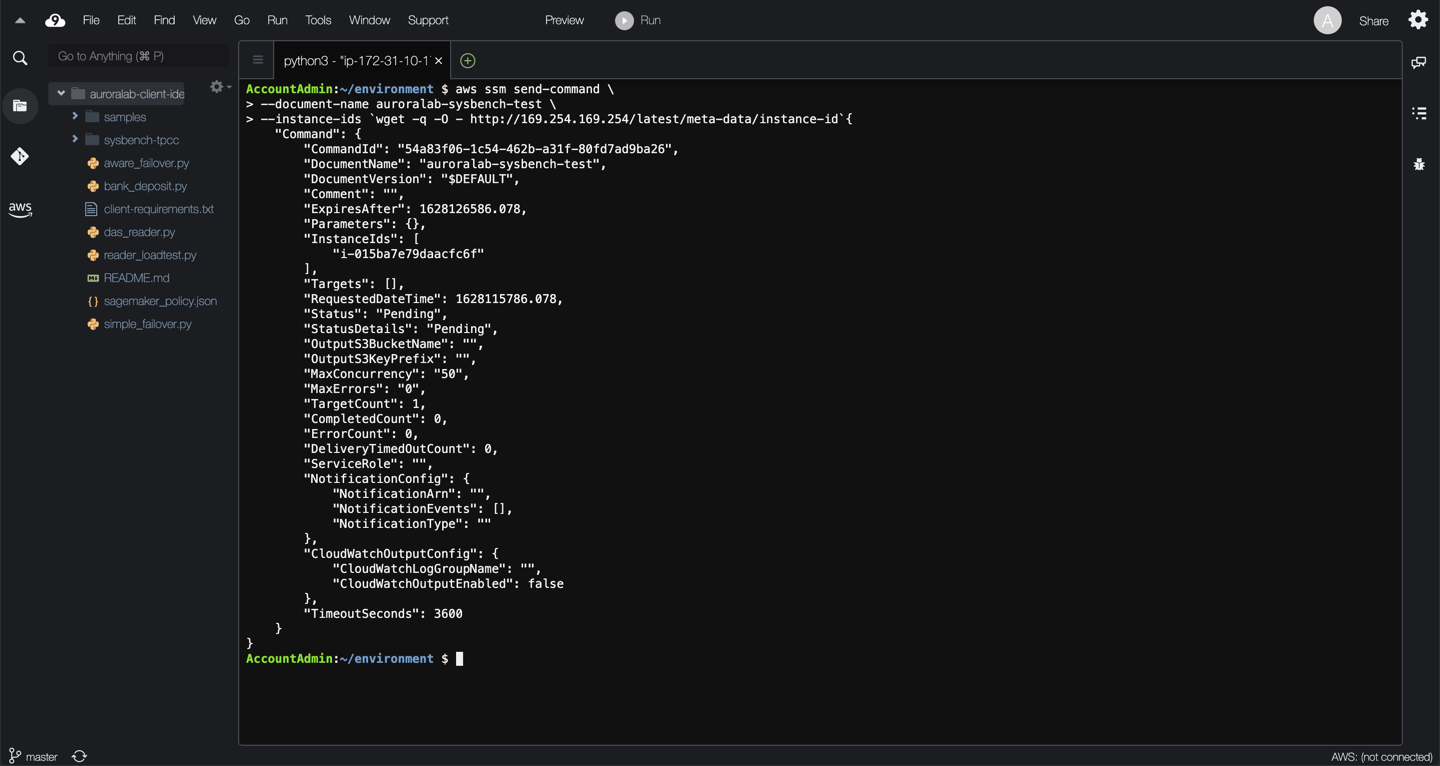
aws ssm send-command \
--document-name auroralab-sysbench-test \
--instance-ids `wget -q -O - http://169.254.169.254/latest/meta-data/instance-id`
=== "I have created the DB cluster myself"
If you have completed the [Create a New DB Cluster](/provisioned/create/) lab, and created the Aurora DB cluster manually execute the command below, replacing the ==[clusterEndpoint]== placeholder with the cluster endpoint of your DB cluster.
aws ssm send-command \
--document-name auroralab-sysbench-test \
--instance-ids `wget -q -O - http://169.254.169.254/latest/meta-data/instance-id` \
--parameters \
clusterEndpoint=[clusterEndpoint],\
dbUser=$DBUSER,\
dbPassword="$DBPASS"
??? tip "What do all these parameters mean?"
Parameter | Description
--- | ---
--document-name | The name of the command document to run on your behalf.
--instance-ids | The EC2 instance to execute this command on.
--parameters | Additional command parameters.
The command will be sent to the Cloud9 desktop EC2 instance which will prepare the test data set and run the load test. It may take up to a minute for CloudWatch to reflect the additional load in the metrics. You will see a confirmation that the command has been initiated.
## 2. Understand the Performance Insights interface
While the command is running, open the Amazon RDS service console at the DB cluster details in a new tab, if not already open.
!!! warning "Region Check"
Ensure you are still working in the correct region, especially if you are following the links above to open the service console at the right screen.
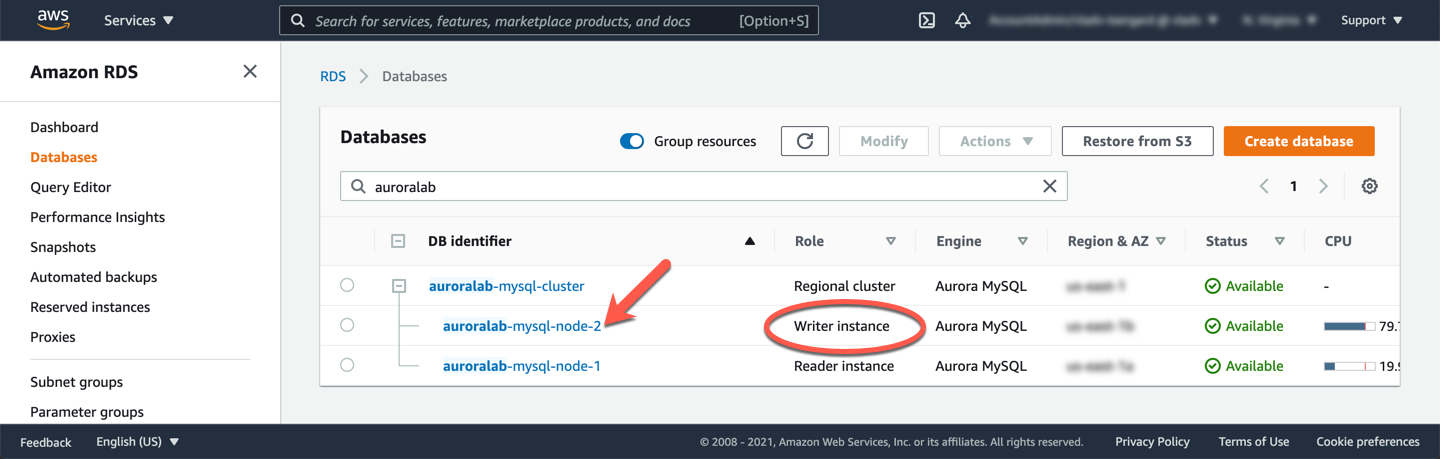
Find the DB instance in the cluster that has the **Writer** role and click on the name, to view the DB instance details.
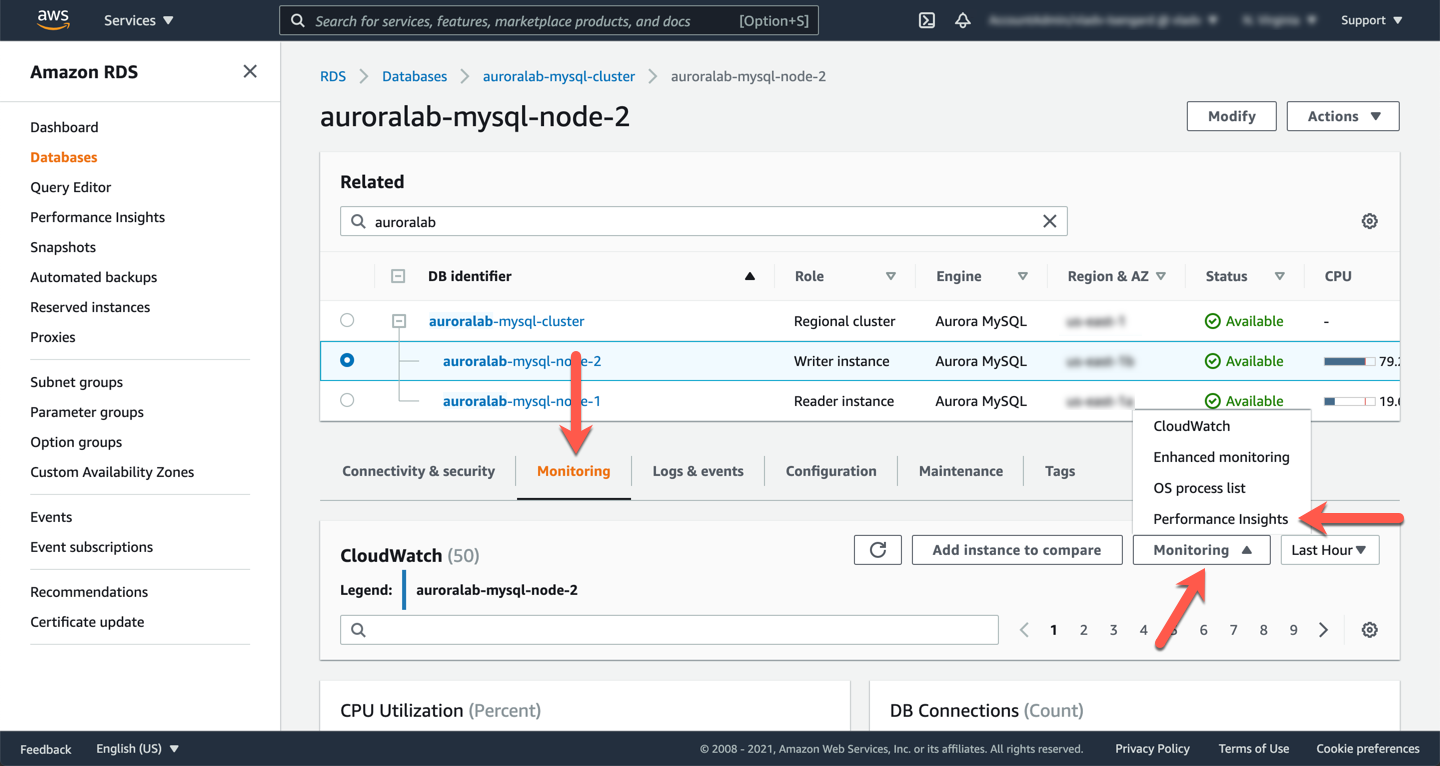
Next, select the **Monitoring** tab, click the **Monitoring** button, to expand the list of available actions, and choose **Performance Insights**. This will open a new browser tab with the **Performance Insights Dashboard** for that DB instance.
The dashboard is divided into 3 sections, allowing you to drill down from high level performance indicator metrics down to individual queries, waits, users and hosts generating the load.
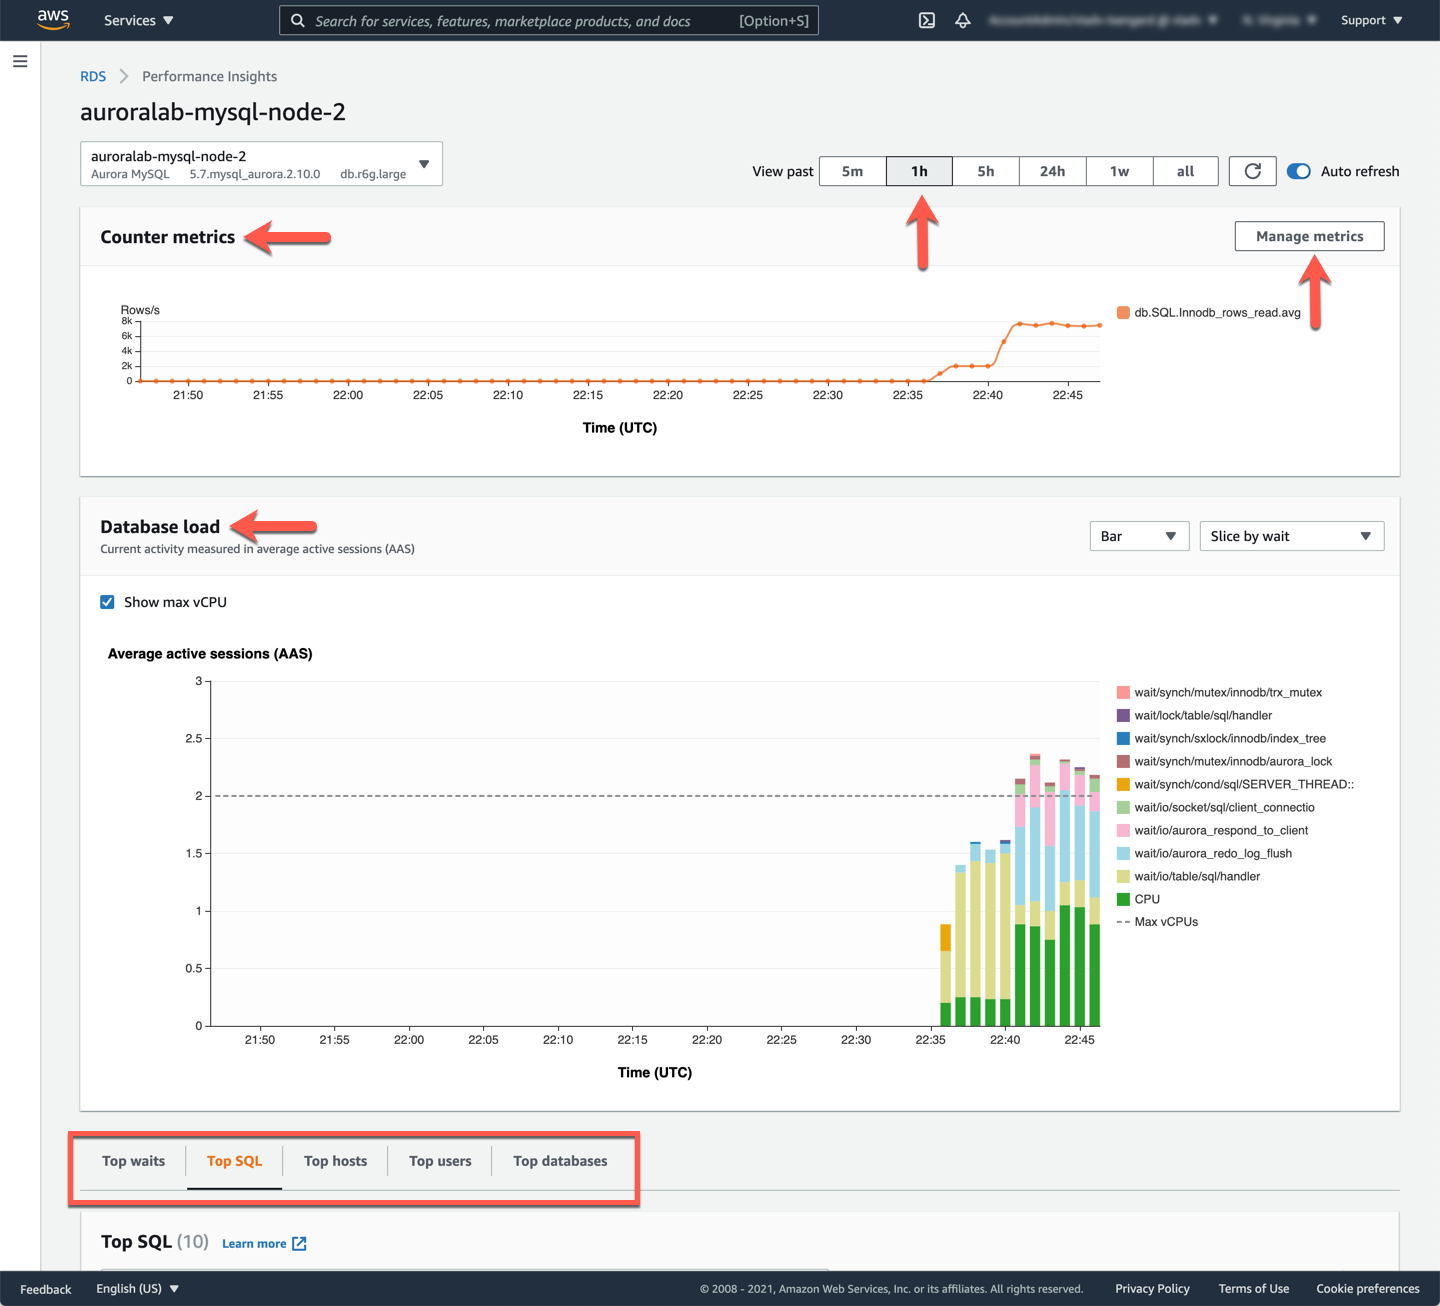
The performance metrics displayed by the dashboard are a moving time window. You can adjust the size of the time window by clicking the buttons across the top right of the interface (`5m`, `1h`, `5h`, `24h`, `1w`, `all`). You can also zoom into a specific period of time by dragging across the graphs.
!!! note
All dashboard views are time synchronized. Zooming in will adjust all views, including the detailed drill-down section at the bottom.
Section | Filters | Description
--- | --- | ---
**Counter Metrics** | Click cog icon in top right corner to select additional counters | This section plots internal database counter metrics over time, such as number of rows read or written, buffer pool hit ratio, etc. These counters are useful to correlate with other metrics, including the database load metrics, to identify causes of abnormal behavior.
**Database load** | Load can be sliced by waits (default), SQL commands, users and hosts | This metric is design to correlate aggregate load (sliced by the selected dimension) with the available compute capacity on that DB instance (number of vCPUs). Load is aggregated and normalized using the **Average Active Session** (AAS) metric. A number of AAS that exceeds the compute capacity of the DB instance is a leading indicator of performance problems.
Granular Session Activity | Sort by **Waits**, **SQL** (default), **Users** and **Hosts** | Drill down capability that allows you to get detailed performance data down to the individual commands.
## 3. Examine the performance of your DB instance
After running the load generator workload above, you will see a performance profile similar to the example below in the Performance Insights dashboard. The load generator command will first create an initial data set using `sysbench prepare`. And then will run an OLTP workload for the duration of 5 minutes, consisting of concurrent transactional reads and writes using 4 parallel threads.
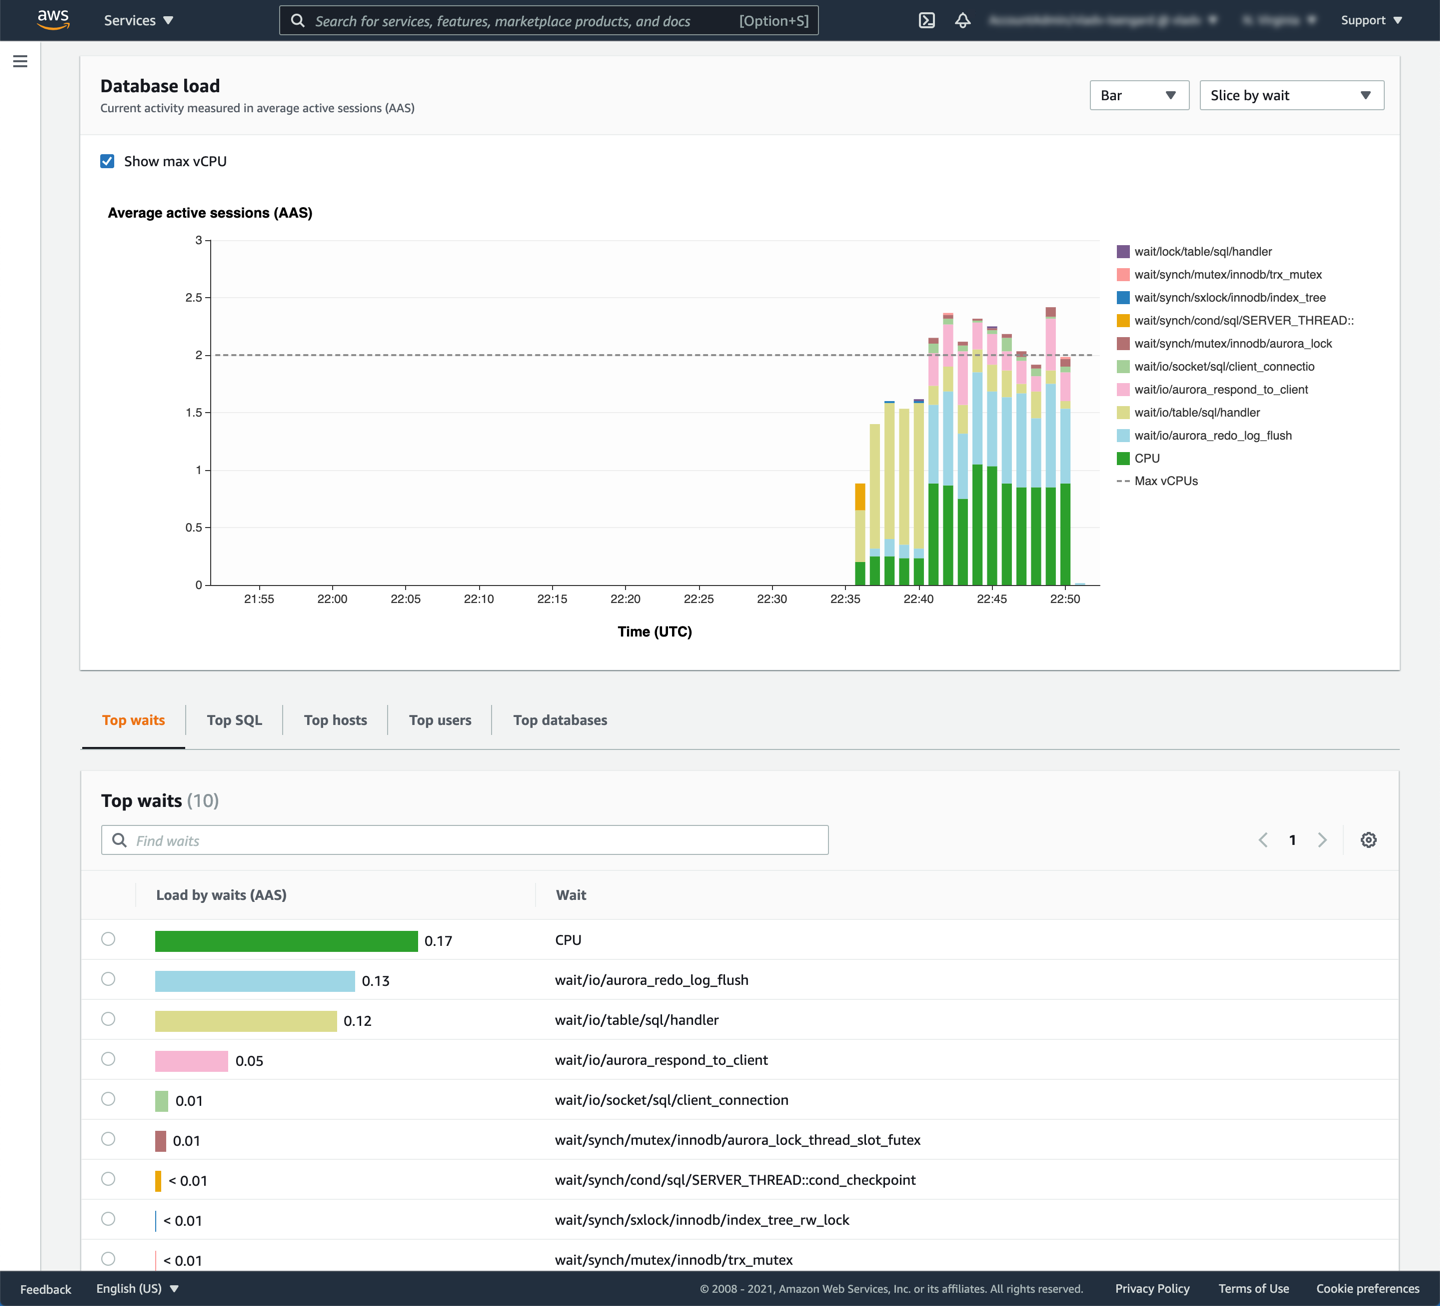
Amazon Aurora MySQL specific wait events are documented in the Amazon Aurora MySQL Reference guide. Use the Performance Insights dashboard and the reference guide documentation to evaluate the workload profile of your load test, and answer the following questions:
1. Is the database server overloaded at any point during the load test?
2. Can you identify any resource bottlenecks during the load test? If so how can they be mitigated?
3. What are the most common wait events during the load test?
4. Why are the load patterns different between the first and second phase of the load test?