# Observe and Identify SQL Performance Issues
This lab will demonstrate how you can use native AWS tools, as well as community tools to achieve observability of your Amazon Aurora database clusters. You will run a sample workload on your database cluster and review monitoring and logging data to analyze the performance of the database and its workload.
This lab contains the following tasks:
1. Prepare the initial dataset
2. Verify the slow query log is configured correctly
3. Run a sample workload
4. Monitor database performance using Amazon CloudWatch Metrics
5. Monitor database performance using Amazon RDS Enhanced Monitoring
6. Dive deeper with Performance Insights
7. Download slow query logs
8. Leverage Amazon CloudWatch Logs and Log Insights to view and analyze slow queries
9. Optional: Process slow query logs with Percona's pt-query-digest
10. Summary
This lab requires the following prerequisites:
* [Get Started](/prereqs/environment/)
* [Connect to the Cloud9 Desktop](/prereqs/connect/)
* [Create a New DB Cluster](/provisioned/create/) (conditional, only if you plan to create a cluster manually)
* [Connect to the DB Cluster and Load Data](/provisioned/interact/)
## 1. Prepare the initial dataset
If you have not already opened a terminal window in the Cloud9 desktop in a previous lab, please [following these instructions](/prereqs/connect/) to do so now. Then, connect to the DB cluster endpoint using the MySQL client, if you are not already connected after completing the previous lab, by running:
```
mysql -h[clusterEndpoint] -u$DBUSER -p"$DBPASS" mylab
```
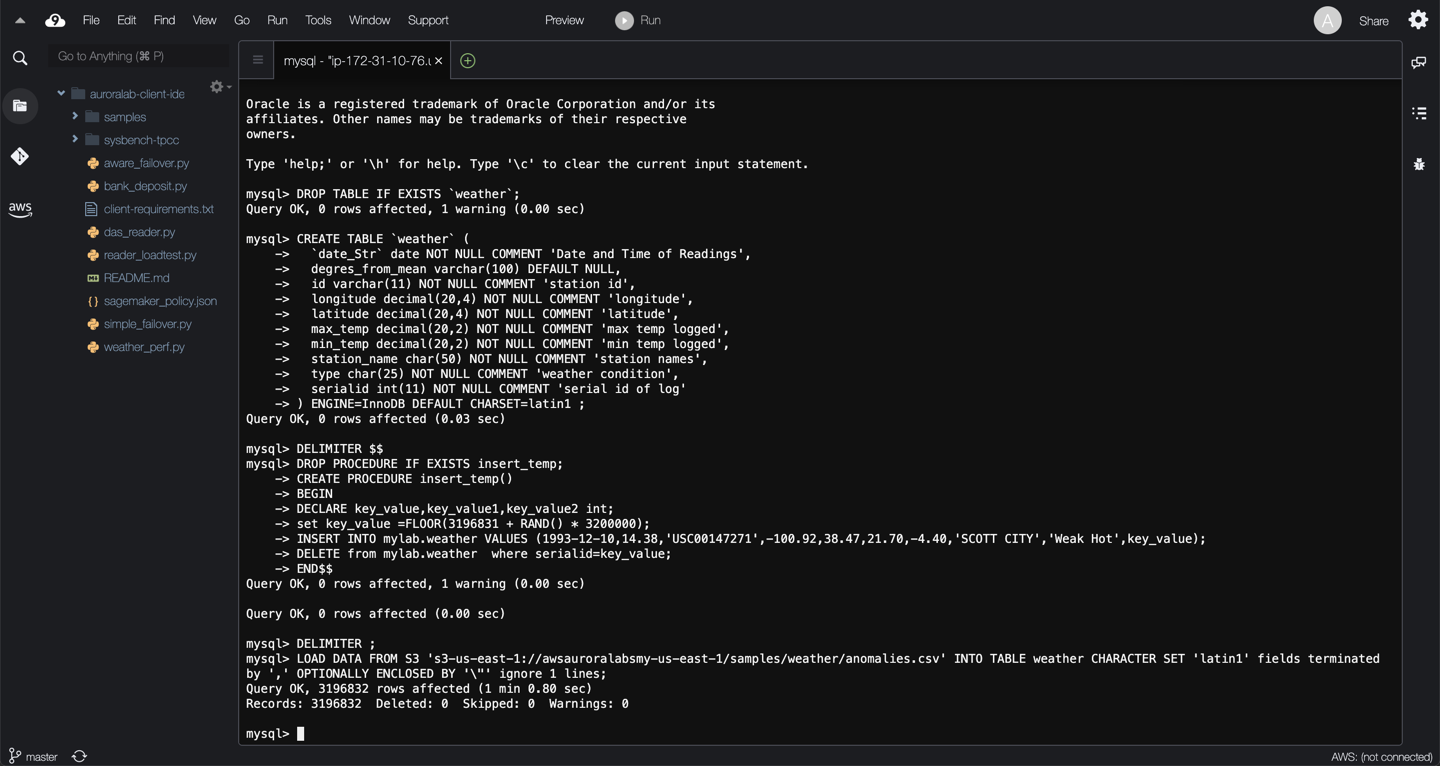
Once connected to the database, please use the code below to create the schema and stored procedure needed later in the lab to generate load on the DB cluster. Run the following SQL queries:
```
DROP TABLE IF EXISTS `weather`;
CREATE TABLE `weather` (
`date_Str` date NOT NULL COMMENT 'Date and Time of Readings',
degres_from_mean varchar(100) DEFAULT NULL,
id varchar(11) NOT NULL COMMENT 'station id',
longitude decimal(20,4) NOT NULL COMMENT 'longitude',
latitude decimal(20,4) NOT NULL COMMENT 'latitude',
max_temp decimal(20,2) NOT NULL COMMENT 'max temp logged',
min_temp decimal(20,2) NOT NULL COMMENT 'min temp logged',
station_name char(50) NOT NULL COMMENT 'station names',
type char(25) NOT NULL COMMENT 'weather condition',
serialid int(11) NOT NULL COMMENT 'serial id of log'
) ENGINE=InnoDB DEFAULT CHARSET=latin1 ;
DELIMITER $$
DROP PROCEDURE IF EXISTS insert_temp;
CREATE PROCEDURE insert_temp()
BEGIN
DECLARE key_value,key_value1,key_value2 int;
set key_value =FLOOR(3196831 + RAND() * 3200000);
INSERT INTO mylab.weather VALUES (1993-12-10,14.38,'USC00147271',-100.92,38.47,21.70,-4.40,'SCOTT CITY','Weak Hot',key_value);
DELETE from mylab.weather where serialid=key_value;
END$$
DELIMITER ;
```
Next, load an initial data set by importing data from an Amazon S3 bucket:
```sql
LOAD DATA FROM S3 's3-us-east-1://awsauroralabsmy-us-east-1/samples/weather/anomalies.csv' INTO TABLE weather CHARACTER SET 'latin1' fields terminated by ',' OPTIONALLY ENCLOSED BY '\"' ignore 1 lines;
```
Data loading may take several minutes, you will receive a successful query message once it completes.
## 2. Verify the slow query log is configured correctly
In many cases the slow query log can be used to find queries that take a long time to execute and are therefore candidates for optimization. Slow query logs are controlled by various parameters and the most notable ones are slow_query_log, long_query_time and log_output.
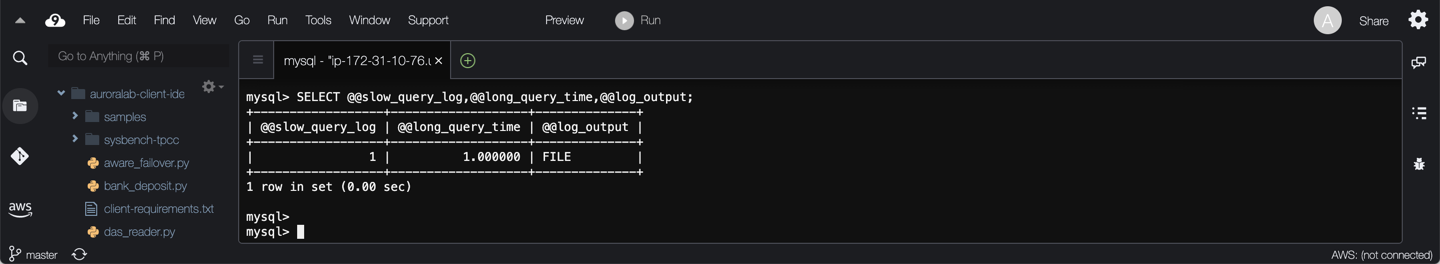
While still connected to the database, run the query below:
```sql
SELECT @@slow_query_log,@@long_query_time,@@log_output;
```
??? tip "Changing slow query log settings in production"
In production systems, you can change the values for **long_query_time** in multiple iterations eg. 10 to 5 and then 5 to 3 and so on to find the best value that fits your workload's needs.
Please make sure your output matches the example above, `slow_query_log = 1`, `long_query_time > 0` and `log_output = FILE`. If your values do not match the configuration above and you are participating in an organized event, please reach out to an assistant.
When completed, exit the MySQL command line:
```
quit;
```
??? tip "Other useful parameters related to slow_log"
There are other useful parameters controlling what statements get captured by the slow query log, such as: log_queries_not_using_indexes and log_slow_admin_statements.
## 3. Run a sample workload
Please run the following command to generate a [sample workload](/scripts/weather_perf.py), replacing the ==[clusterEndpoint]== placeholder with the cluster endpoint of your DB cluster.
```
python3 weather_perf.py -e[clusterEndpoint] -u$DBUSER -p"$DBPASS" -dmylab
```
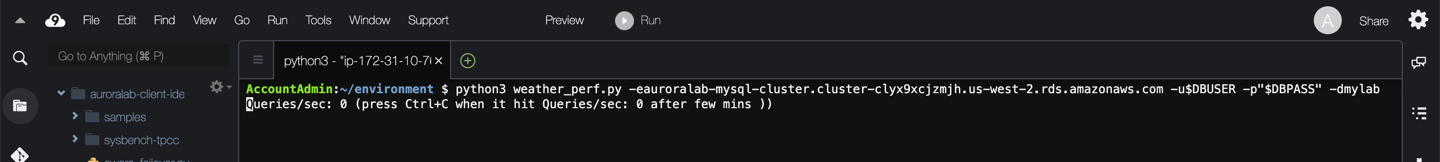
This script will take about 4 ~ 5 minutes to complete but you do not need to wait to proceed further.
## 4. Monitor database performance using Amazon CloudWatch Metrics
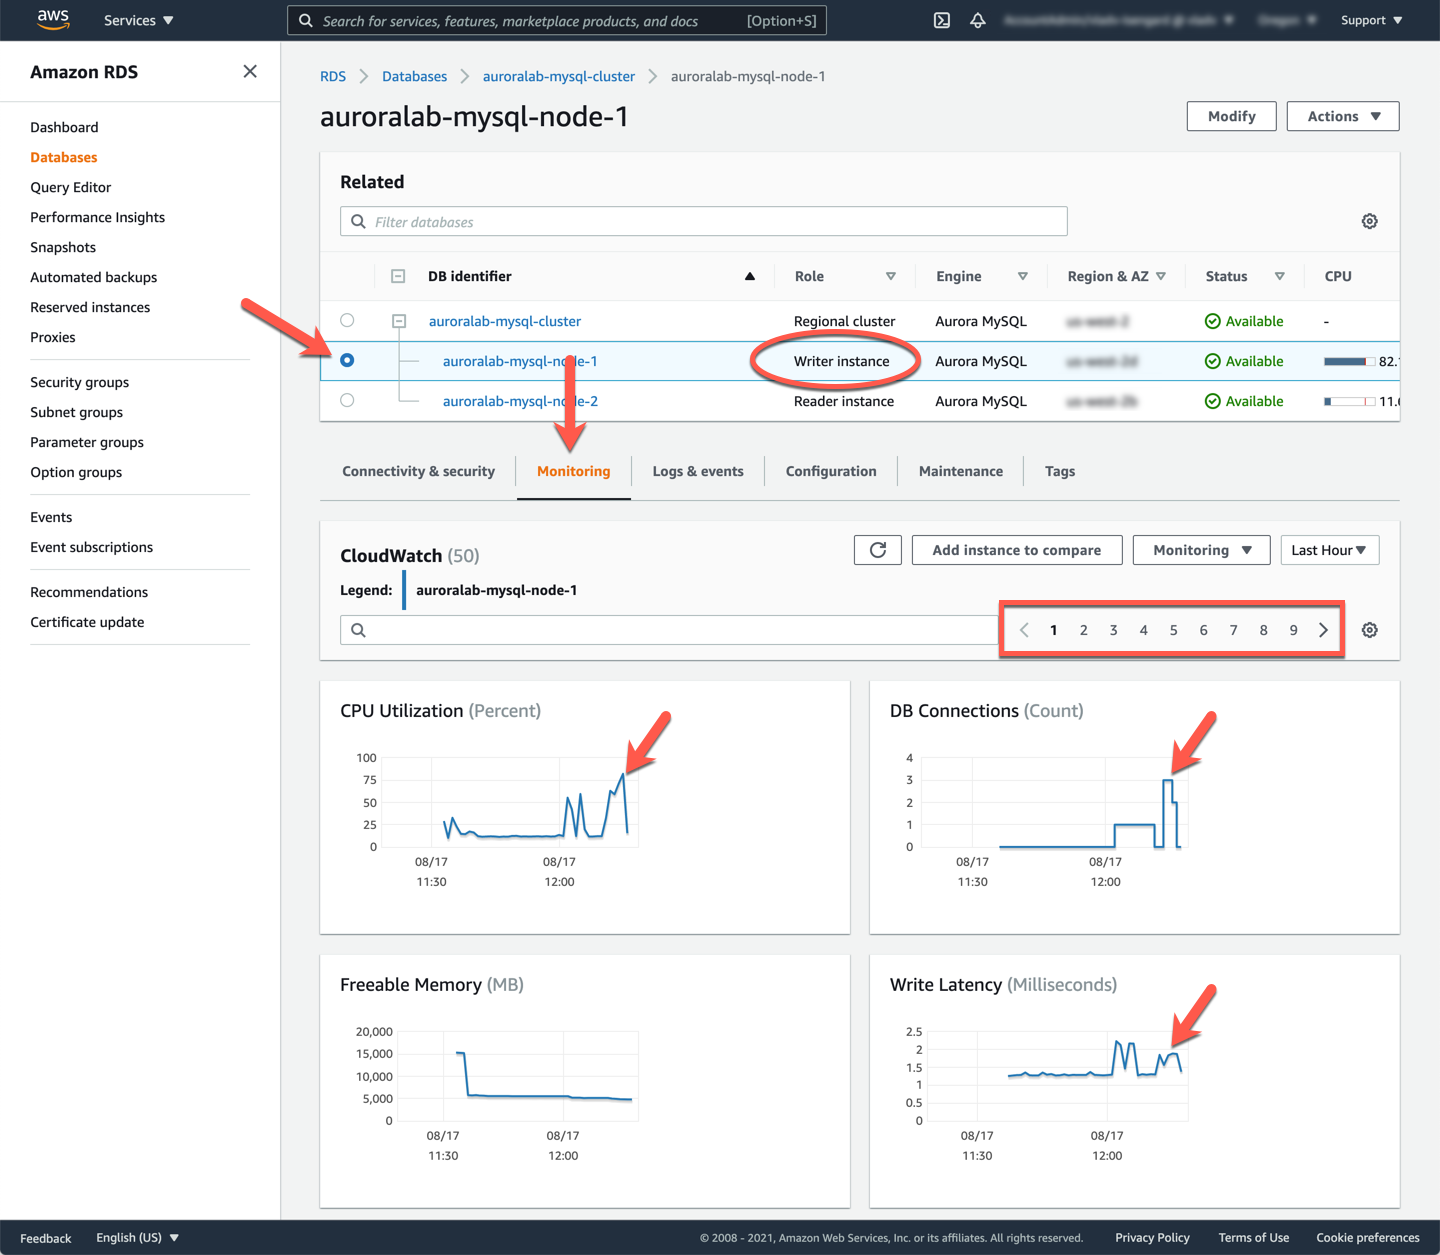
For monitoring you can use Amazon CloudWatch, which collects and processes raw data from Amazon RDS into readable, near real-time metrics. While the script is running, open the Amazon RDS service console at the DB cluster details page in a new tab, if not already open. Find the DB instance in the cluster that has the **Writer instance** role and click on the name, to view the DB instance CloudWatch metrics.
Although all the metrics are important to monitor, base metrics such as: `CPU Utilization`, `DB Connections`, `Write Latency` and `Read Latency` can be viewed as leading indicators. You should see them spiking as a result of the workload you previously started. You can click on any chart to drill down for more details and select any chart area to zoom in on a specific time period to understand the overall workload and its impact on the database.
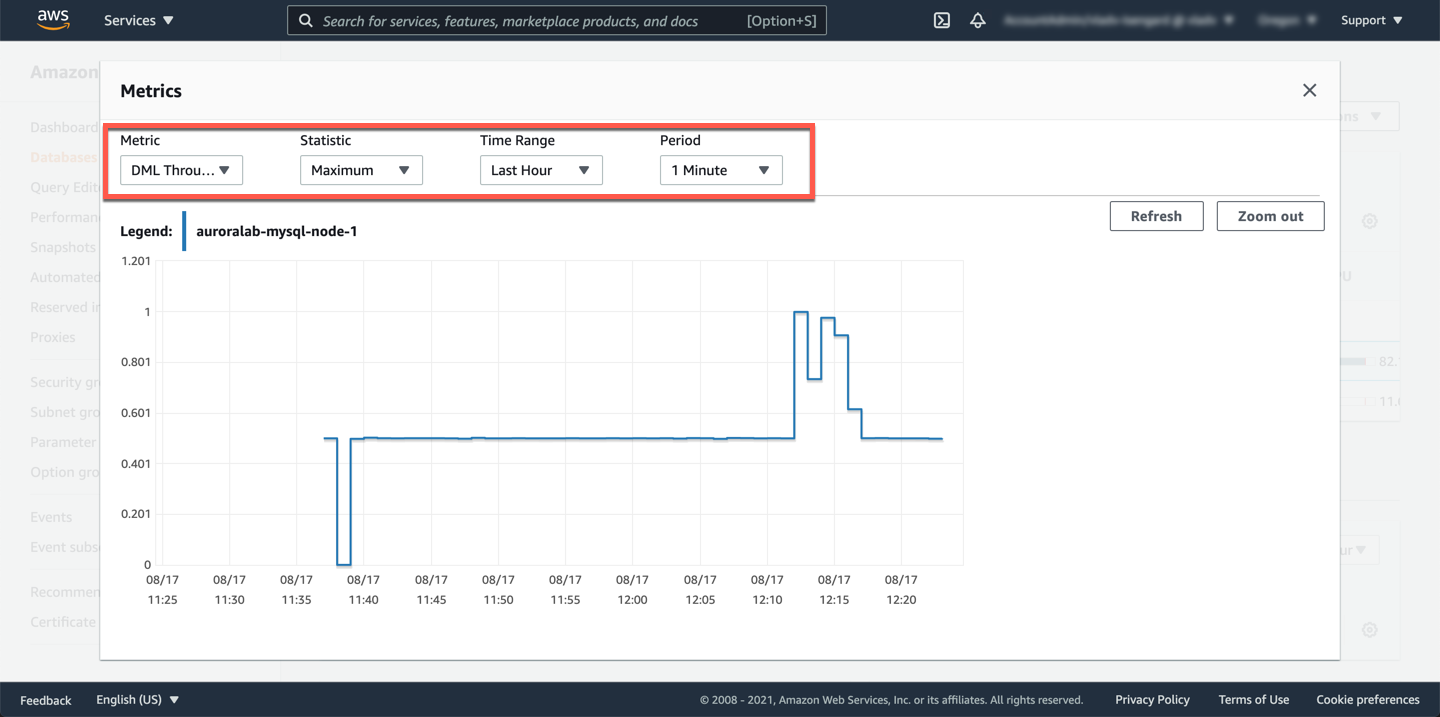
Amazon Aurora also provides a range of dedicated CloudWatch metrics populated with various database status variables. Find the `DML Throughput` metric and click on the graph. In the detail overlay you can adjust the chart as needed.
In general:
* database activity variables responsible for tracking *throughput* are modified when the statement is received by the server.
* database activity variables responsible for tracking *latency* are modified after the statement completes.
This is quite intuitive: statement latency (i.e. execution time) is not known until the statement finishes.
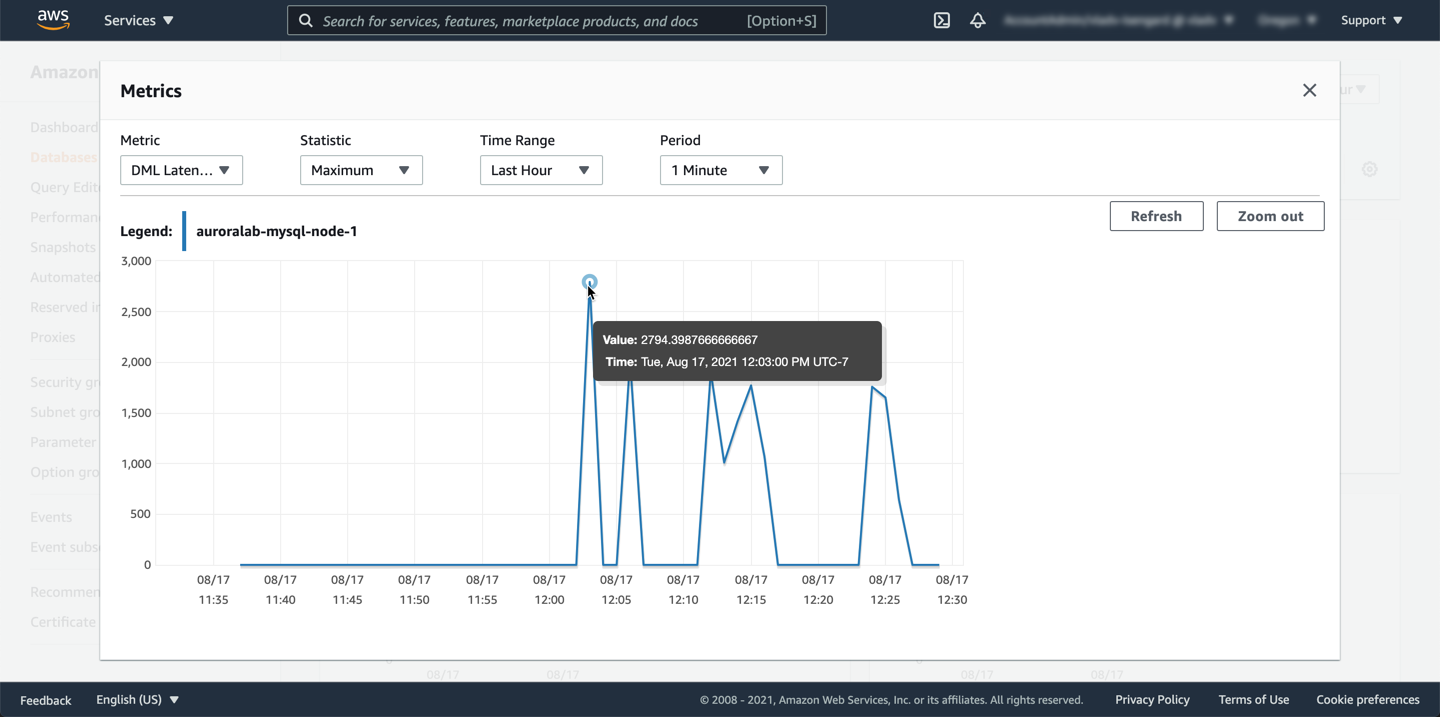
Similarly, find the `DML Latency metric and click on the graph. In the detail overlay you can find the exact data point details.
??? tip "Learn more about Aurora monitoring"
To learn more about how to plan for Aurora monitoring and performance guidelines please refer our Aurora Monitoring documentation.
The **DML Latency** metric reveals a spike at 12:03pm, when the metric reached 2794 milliseconds. In other words, 2.7 seconds is the maximum latency of all DML statements that finished during that 1-minute period. 2.7 seconds is significantly higher than the baseline latency observed before the spike, therefore it’s worth investigating.
A useful piece of information readily available from DML Throughput metric . At 12:03pm DML throughput is 0.500 which is roughly 30 operations per minute. This could be the reason for the DML latency we noticed before.
```
.5 operations/sec X 60 sec= 30 operations/min
```
!!! note "Monitoring the baseline"
Once the performance baseline is understood you can setup alarms against CloudWatch metrics to alert when they exceed the baseline, so you can take corrective actions.
## 5. Monitor database performance using Amazon RDS Enhanced Monitoring
You must have noticed that the CloudWatch metrics did not reflect the workload right away, different metrics have different reporting intervals (periods). Most Aurora metrics use a **1 minute** reporting interval, some (such as `CPU Utilization`) use a **5 minute** interval, and a few an even longer interval. However, to monitor and understand operating system or host level metrics, such as whether the CPU is consumed by user tasks or system tasks, or to see free/active memory with granularity as low as **1 second**, RDS Enhanced Monitoring (EM) is the appropriate tool to use.
Your DB cluster was created with Enhanced Monitoring enabled, you can view the metrics by selecting the DB cluster instance → **Monitoring** → select **Enhanced Monitoring** option from the **Monitoring** **dropdown** list. For more information about enabling and using the Enhanced Monitoring feature, please refer to the Enhanced Monitoring documentation.
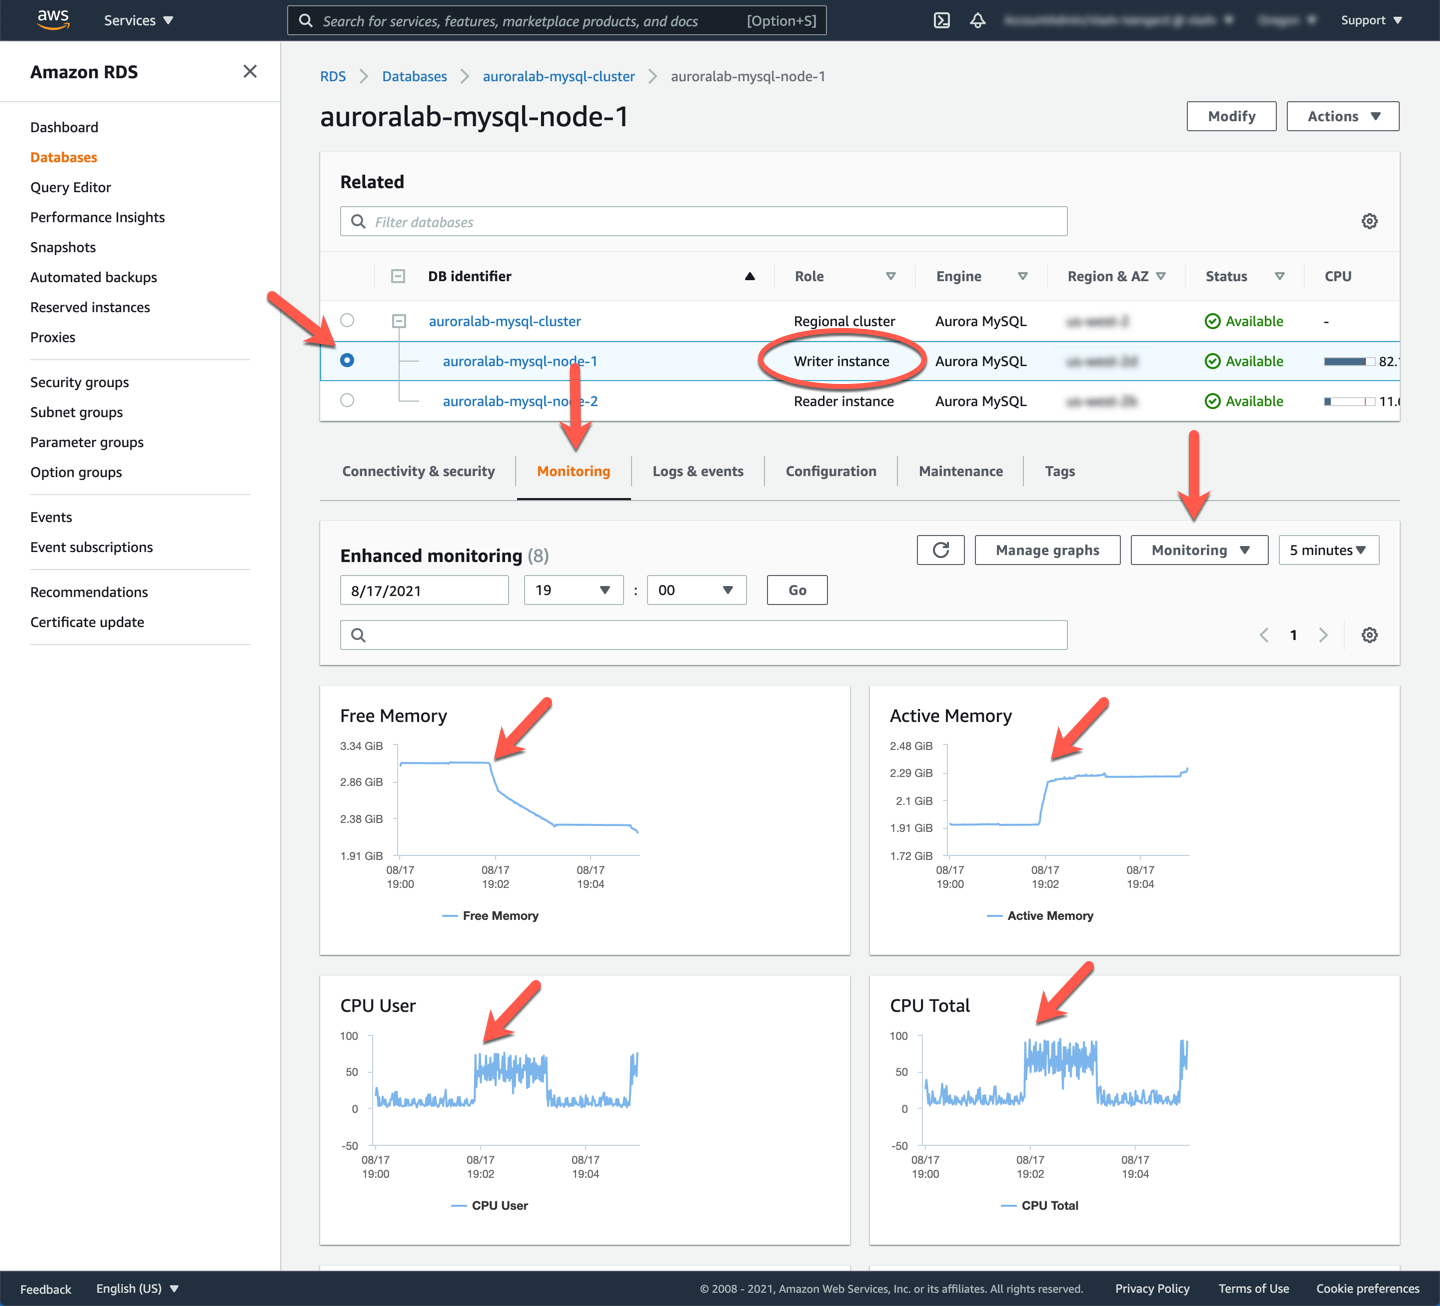
From the above, you can see when the workload kicked in, there is a sharp `spike` in CPU driven by `User` and `drop` in Free memory. You can also locate the `Load average` metrics, and see they have increased during this period.
!!! tip "Additional metrics available"
You will see additional counters showing metrics captured at the operating system level as well as local, temporary storage (not the persistent Aurora storage volume).
## 6. Dive deeper with Performance Insights
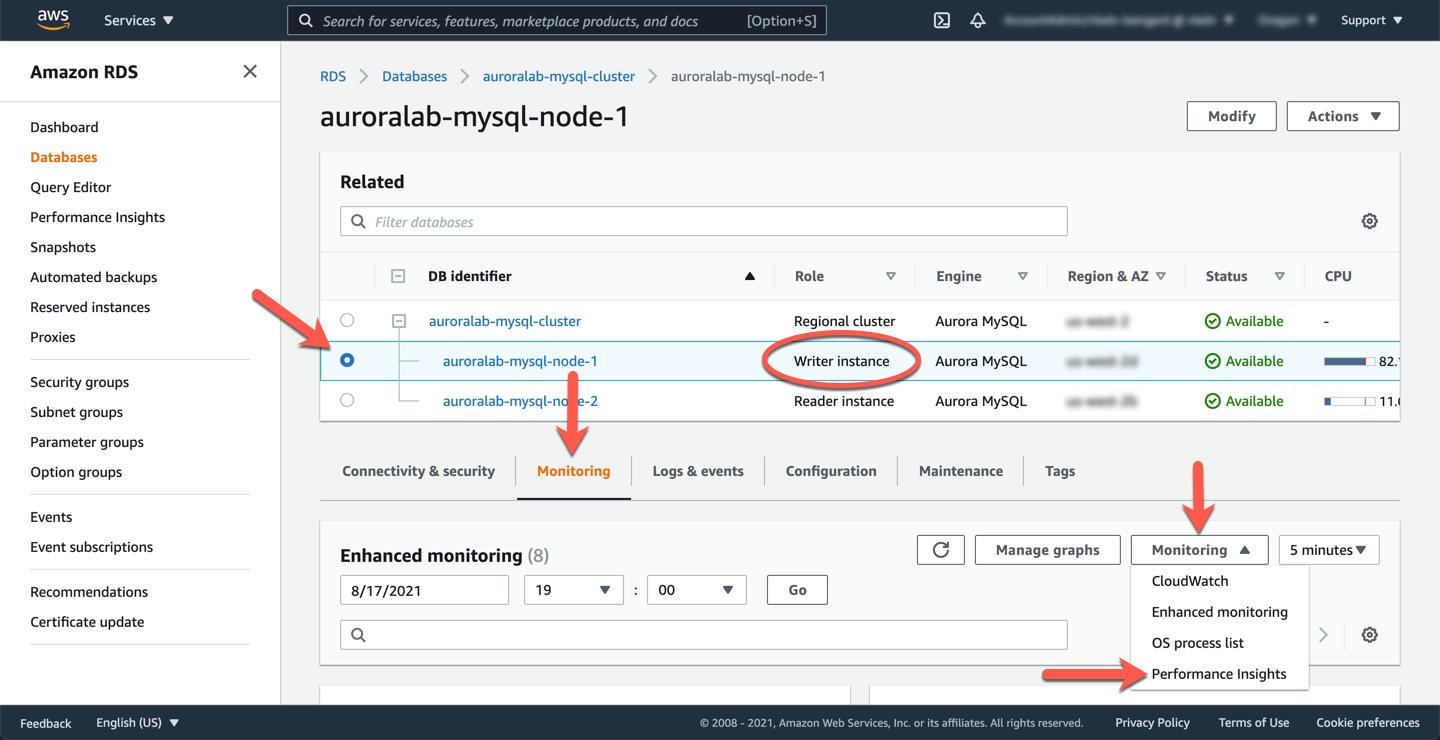
Amazon RDS Performance Insights monitors your Amazon RDS DB instance load so that you can analyze and troubleshoot your database performance. To view the current Performance Insights dashboard, from the current database instance page, click the **Monitoring** dropdown button, and choose **Performance Insights**.
The dashboard is divided into 3 sections (Counter Metrics, Database Load and Top activity), allowing you to drill down from high level performance indicator metrics down to individual queries, wait events, hosts, databases and users. You can learn more about Performance Insights in the [Use Performance Insights lab](https://awsauroralabsmy.com/provisioned/perf-insights/).
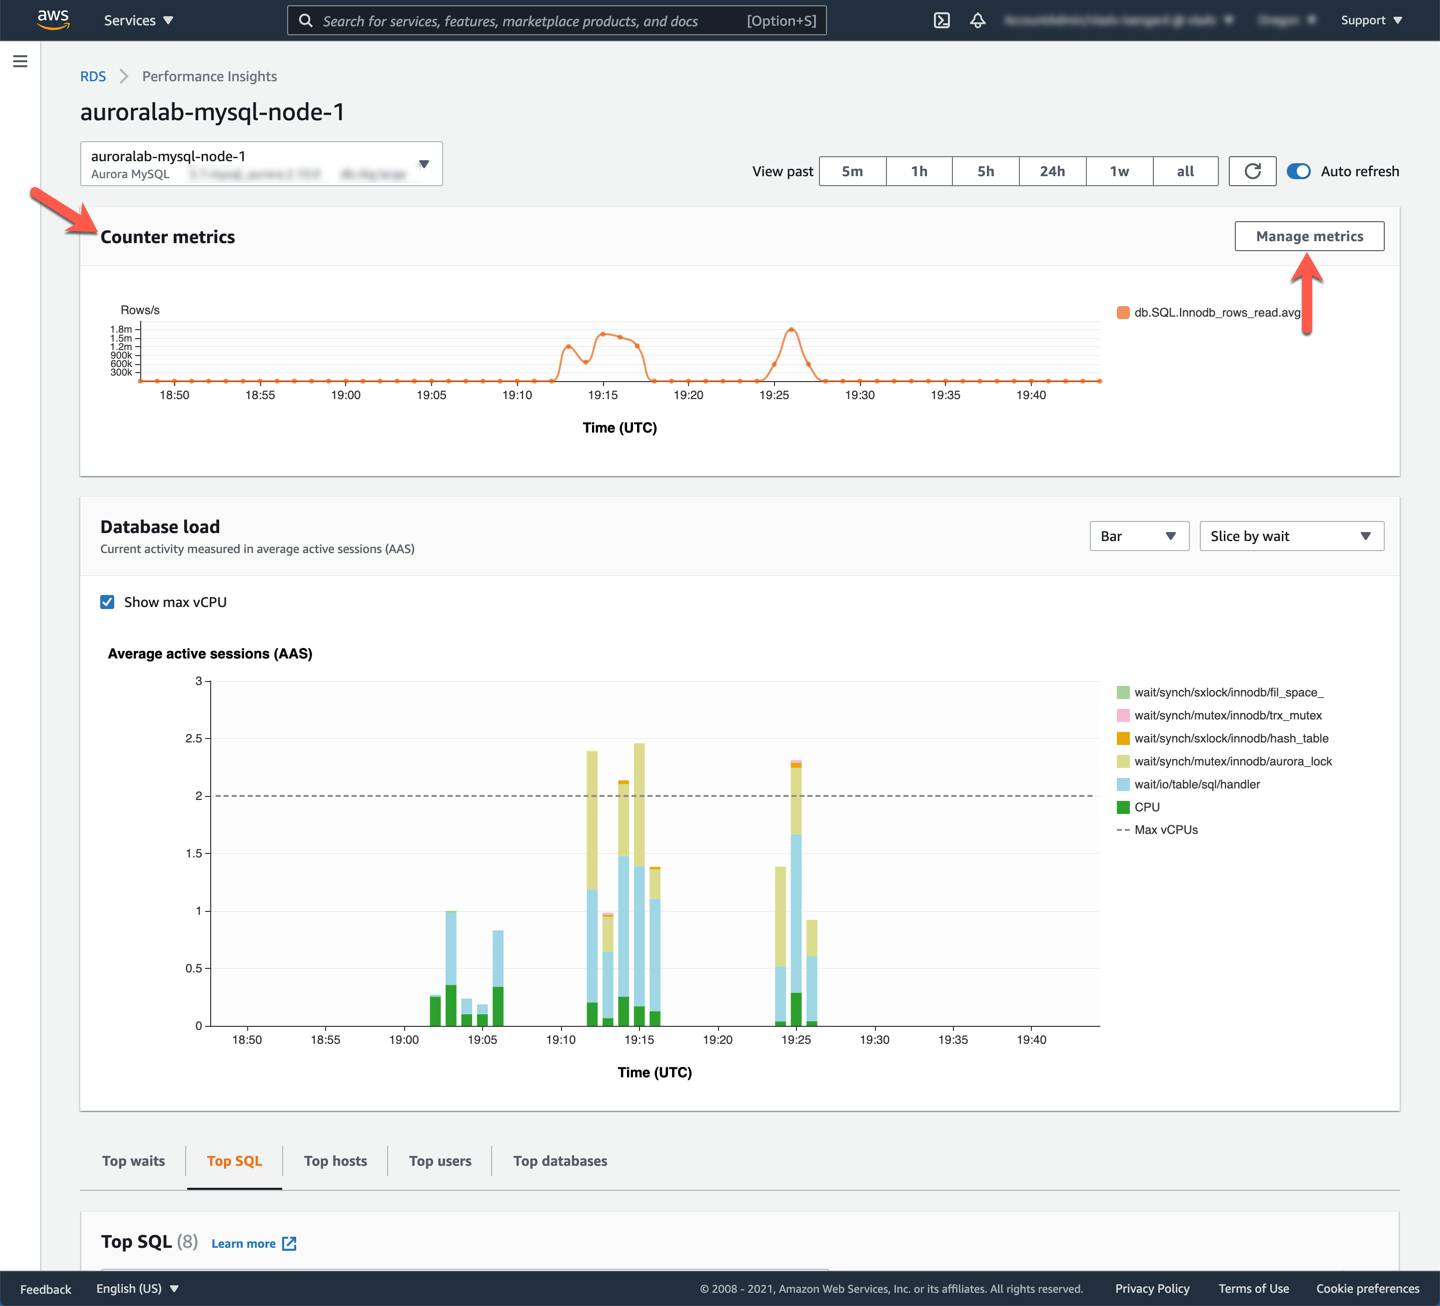
Start by adding additional counters in the **Counter Metrics** section, by clicking the **Manage Metrics** button. These metrics are categorized into **OS metrics** and **Database metrics** and add valuable information on top of CloudWatch metrics. Use the tabs across the top of the panel to navigate between the categories.
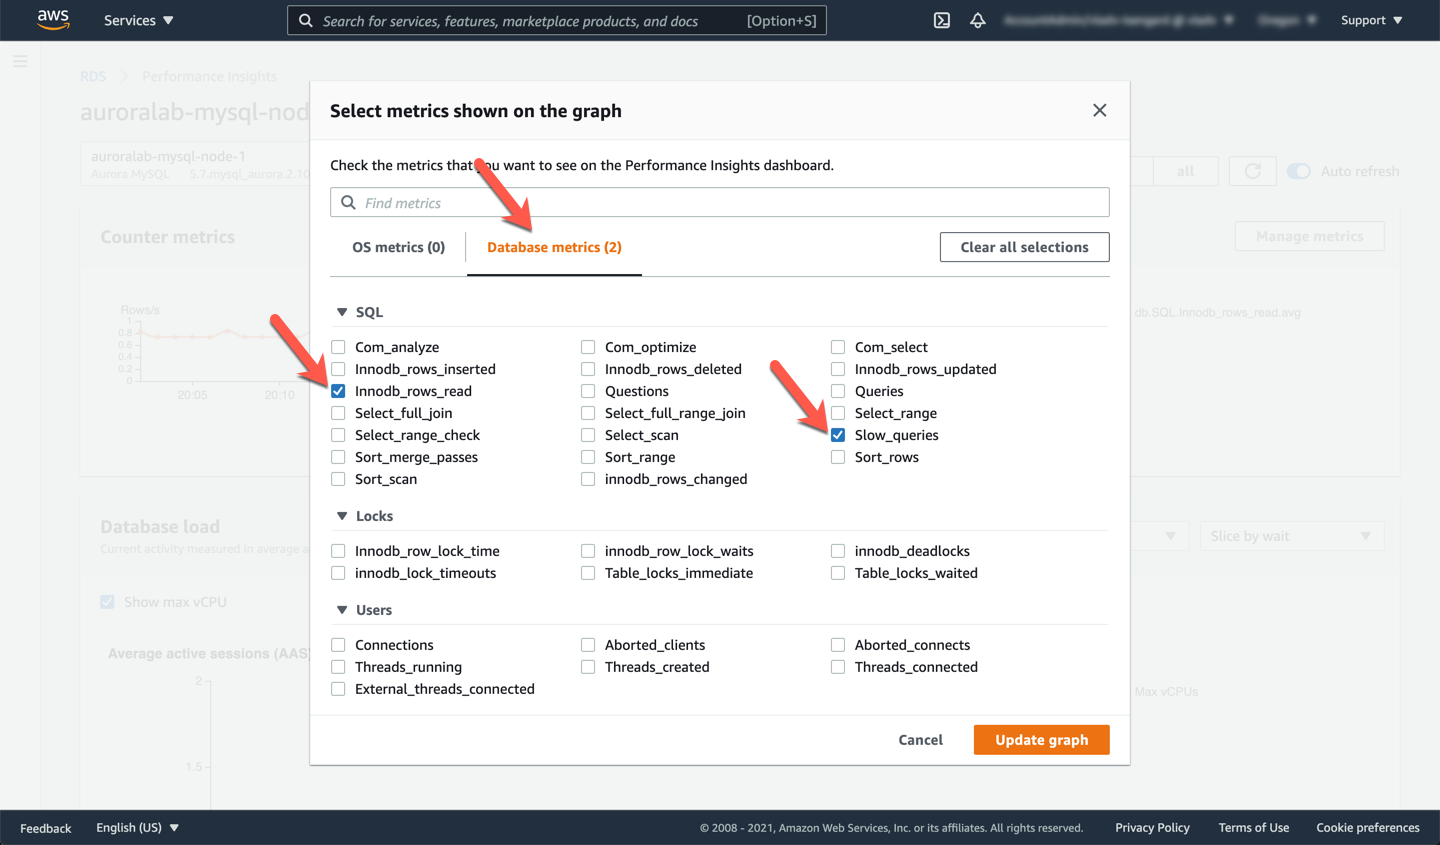
From **Database metrics** select at least:
* [ ] `Innodb_rows_read`
* [ ] `Slow_queries`
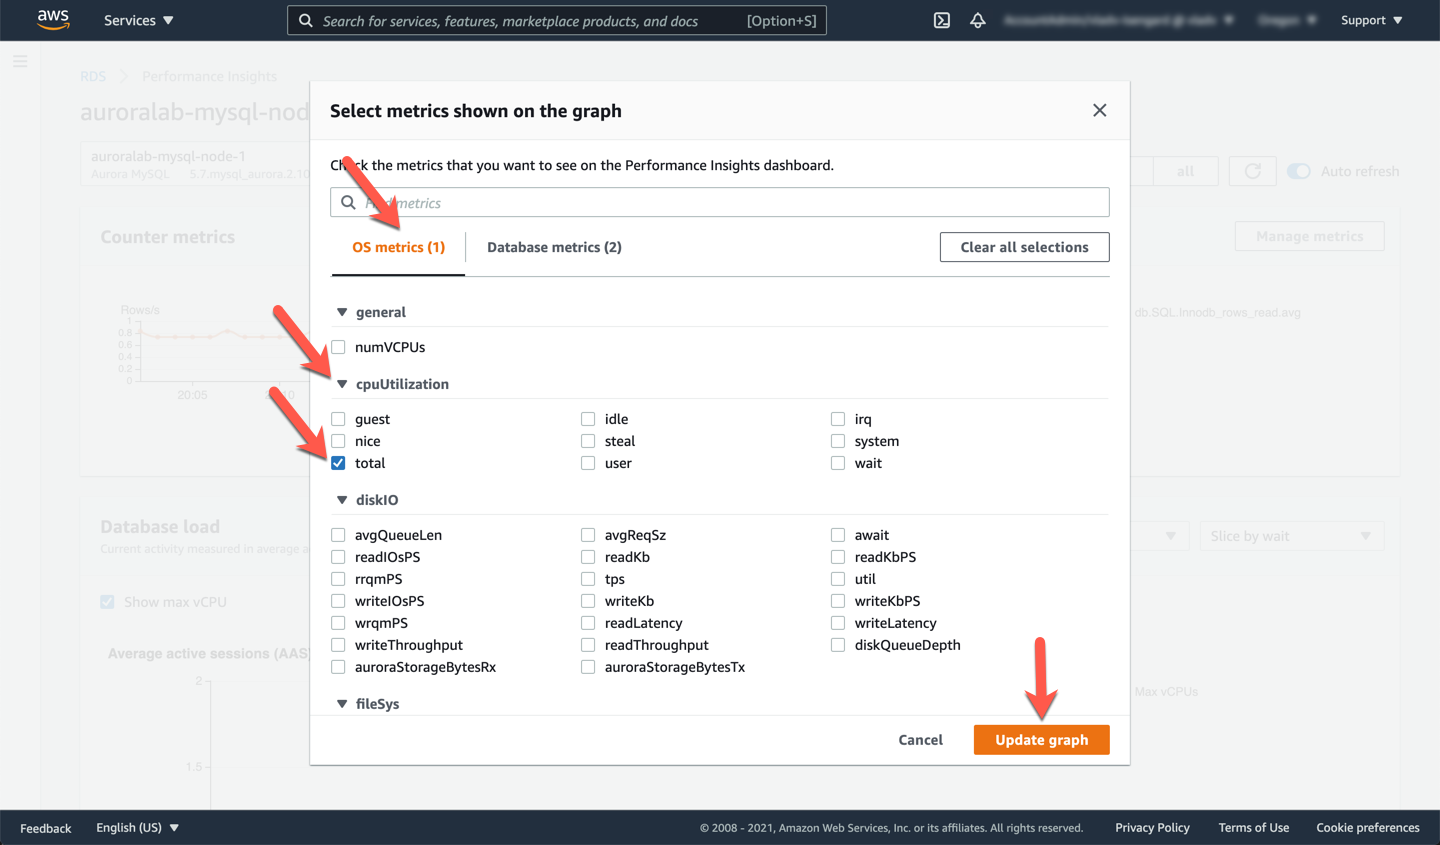
From **OS metrics** select at least:
* [ ] `cpuUtilization > total`
* [ ] `Slow_queries`
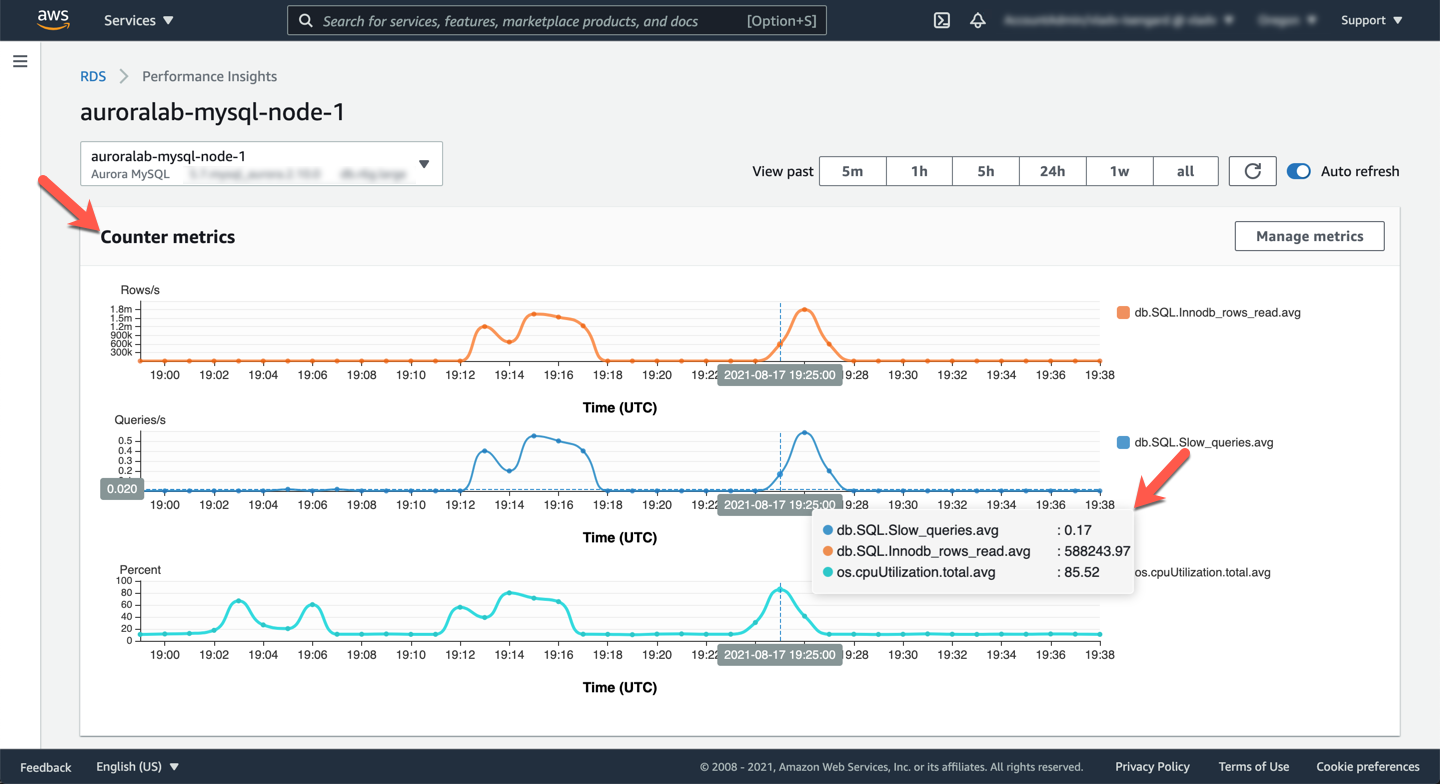
Click **Update graph** and once done, the counter metrics should look like the example below. You can see a CPU spike to ~85%, the number of rows read is `1+ million` shortly thereafter, and slow logs were getting logged for this time period.
Next, correlate these counters with database wait events to understand the workload. Scroill down to the **Database load** section. You can see different wait events on the right hand side.
!!! note "What do the wait events mean?"
Many wait events Amazon Aurora MySQL emits are the same as in MySQL Community Edition, and can be found in the MySQL documentation. Aurora specific wait events are documented in the Amazon Aurora MySQL Reference Guide
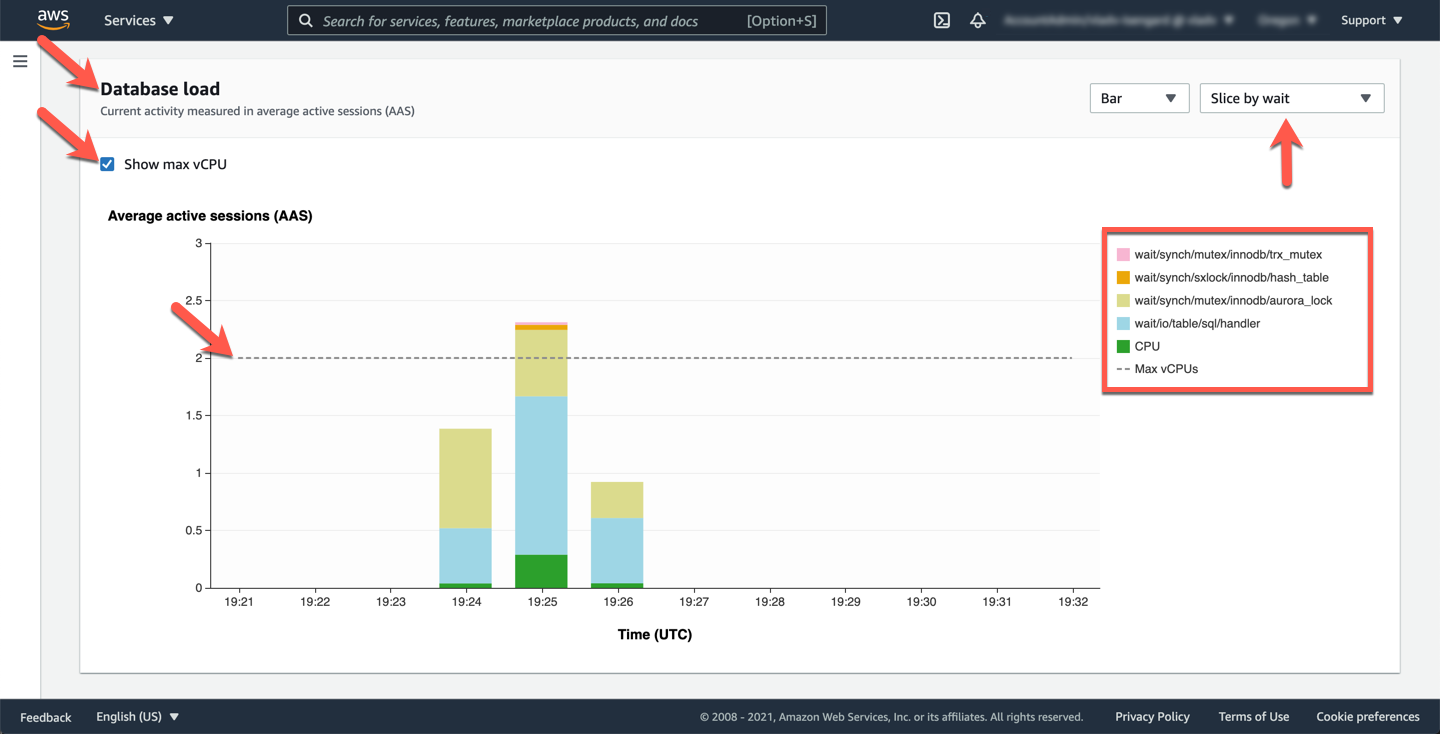
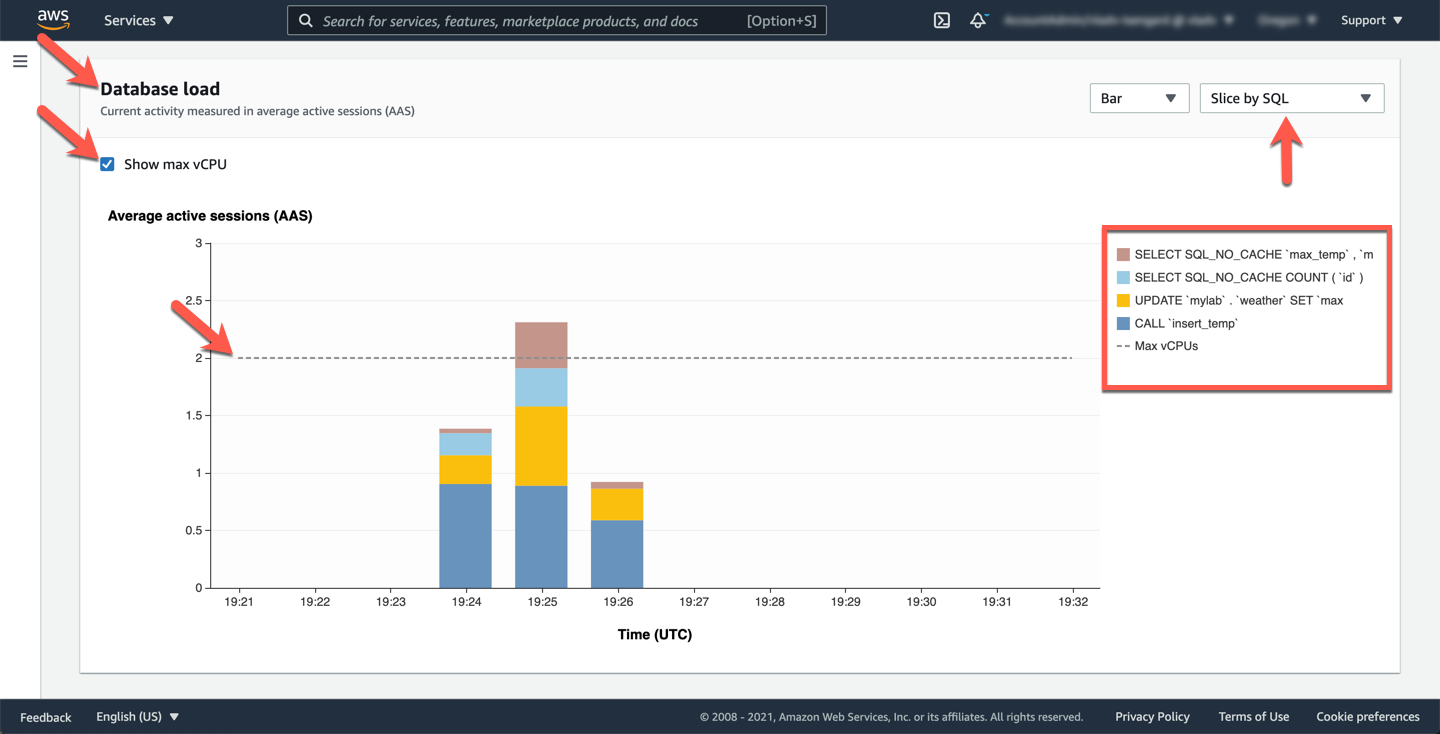
You can also change the view of **DB Load** section from `Slice by wait` to `Slice by SQL` to understand the AAS of different queries during this time. You can also see the the max number of available **vCPUs** is 2 but the current sessions exceeds the max vCPU and this in many cases would be driving factor for CPU/memory consumption.
Finally, drill down deeper into the performance of the queries discovered above. In the **Top activity** section, the default interface shows **Top SQL**, along with some statistics for each of the top query patterns. For each query pattern you can observe the `Load by SQLs (AAS)` (AAS stands for Average Active Sessions), the query pattern text, `Rows examined/call` and `Rows sent/call`.
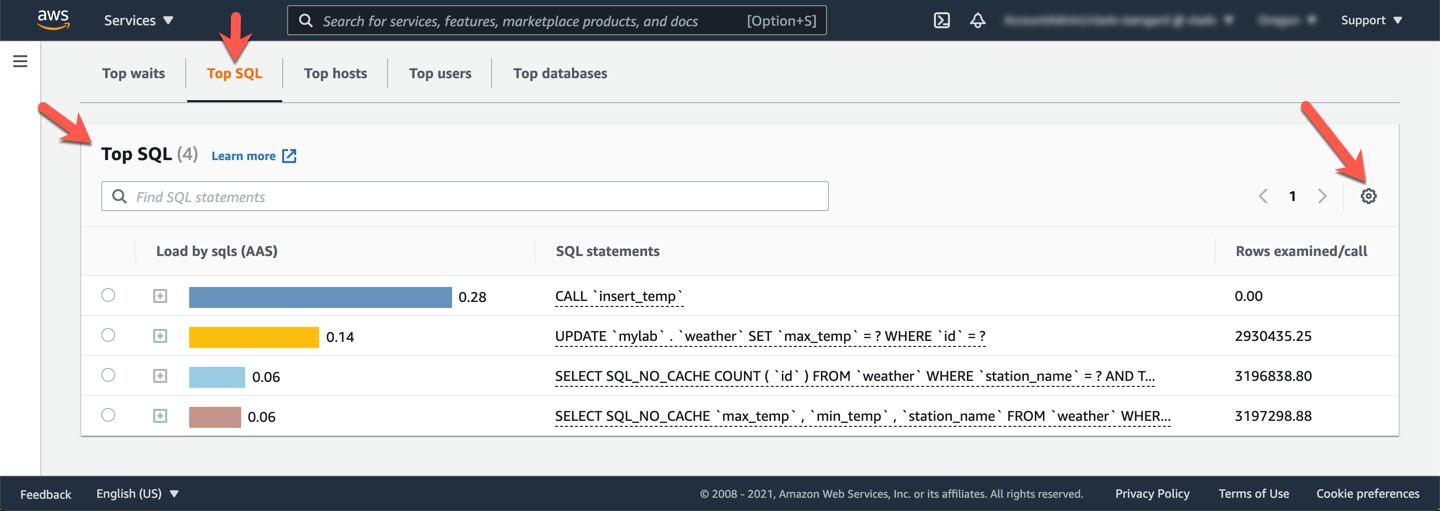
Go to **Preferences** (gear icon at the right hand side) and add additional columns with additional useful counters. Add the following counters, then click **Save**:
* [ ] Rows affected/sec
* [ ] Rows affected/call
* [ ] Rows examined/sec
* [ ] Rows examined/call
* [ ] Rows sent/sec
* [ ] Rows sent/call
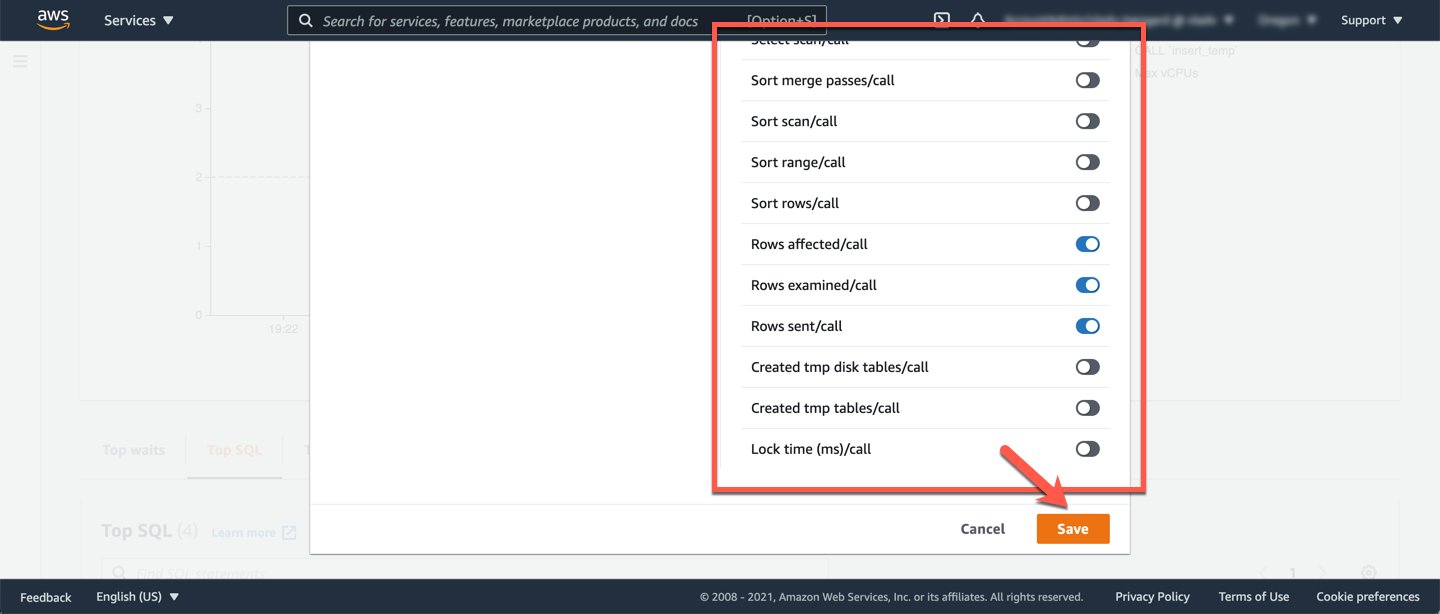
Once saved, the session activity for **Top SQL** would look like below. You should be able to see **rows examined/s** vs **rows sent/s** and corresponding **avg. latency** in ms/call. You should focus on the queries with large difference between rows examined and rows sent.

!!! tip "What's inside a stored procedure?"
To see the queries inside a stored procedure, please click and expand the `+` (plus) icon.
You can note down the top SQL queries but please keep in mind not all **Top SQL** queries are slow queries, it only means that these queries are representing the load at a given point in time.
You can use Performance Insights to understand average activity, however to get individual query statistics and execution time for long running queries, you should leverage the slow query log.
## 7. Download slow query logs
In this sections you will learn how to view the slow query logs using the AWS Management Console. Since the workload script was ran against the cluster endpoint (which points to the writer node by default), you should check the writer node logs. Open the Amazon RDS service console at the cluster detail page and select the writer node. Once selected, under **Logs & Events** please scroll down to the **Logs** section.
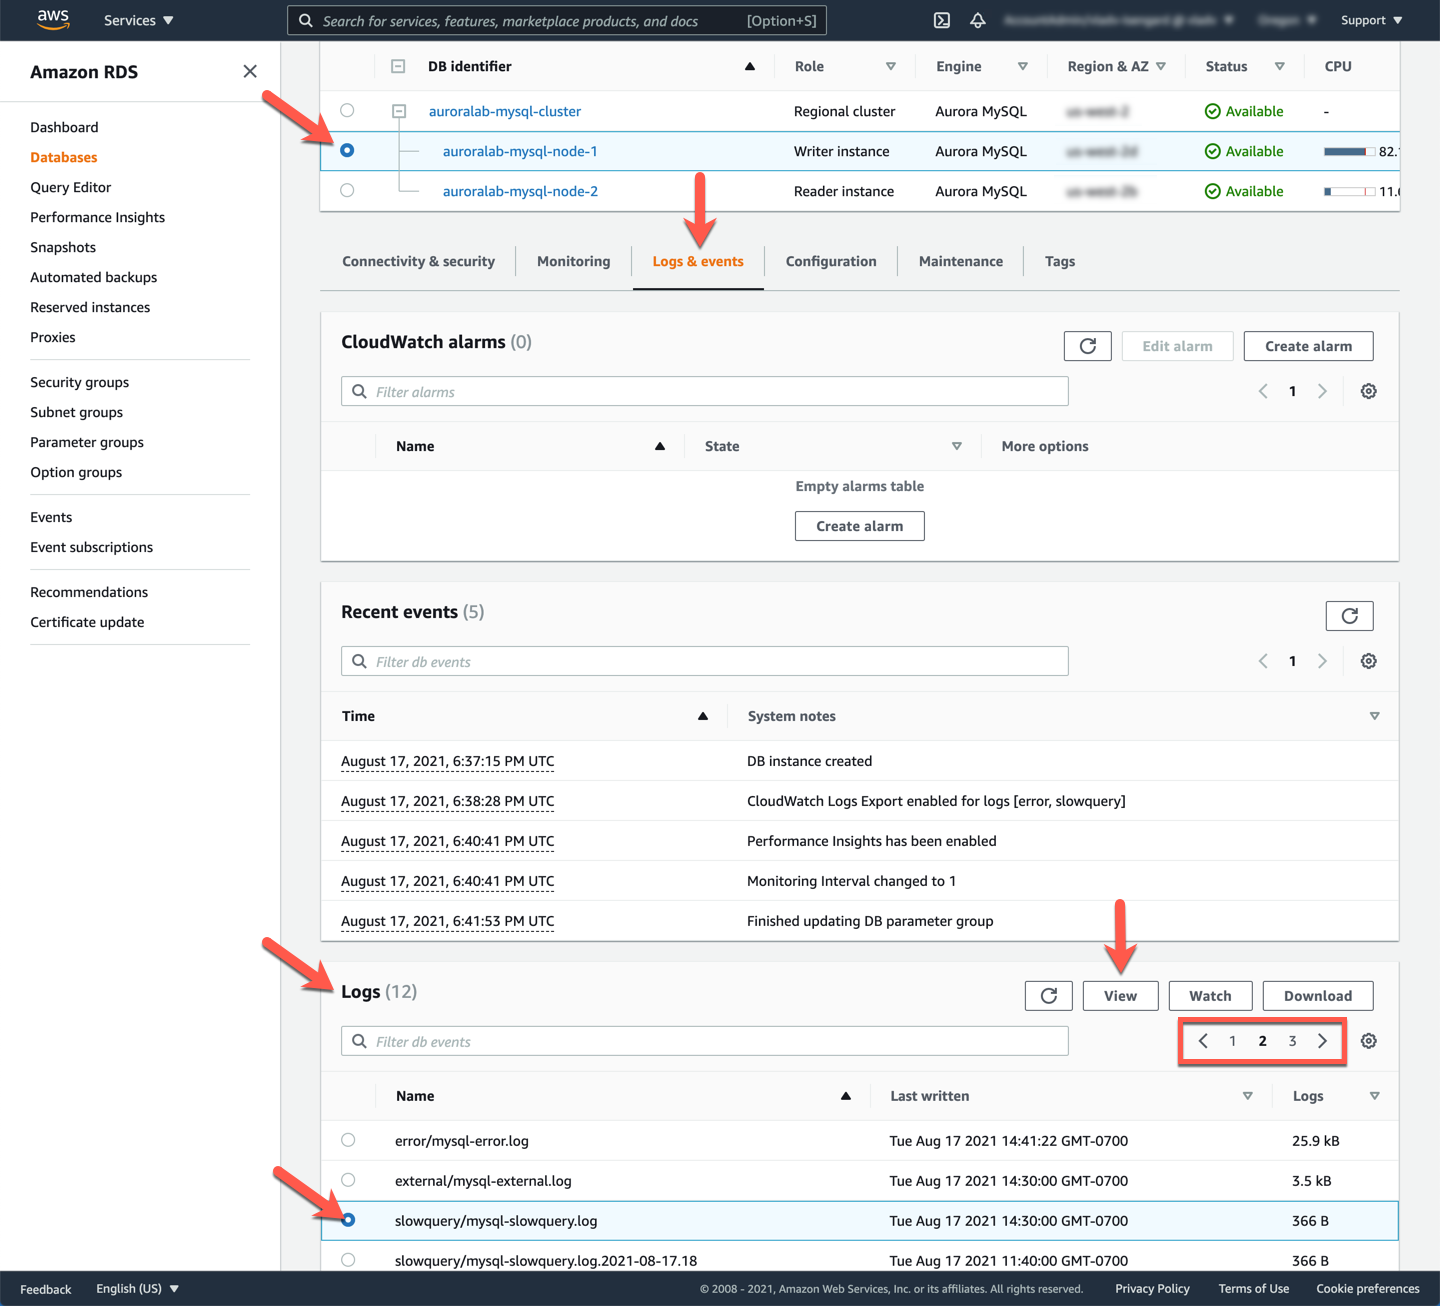
You can select the slow query log for the timeframe and **View** or **Watch** it. Below example shows the log when you **View** it.
!!! note "Log Rotation"
Log files are rotated automatically hourly, the information you are looking for may not be in the current log file. Find the log file for the time your workload has been running, and when the events you need to investigate occurred
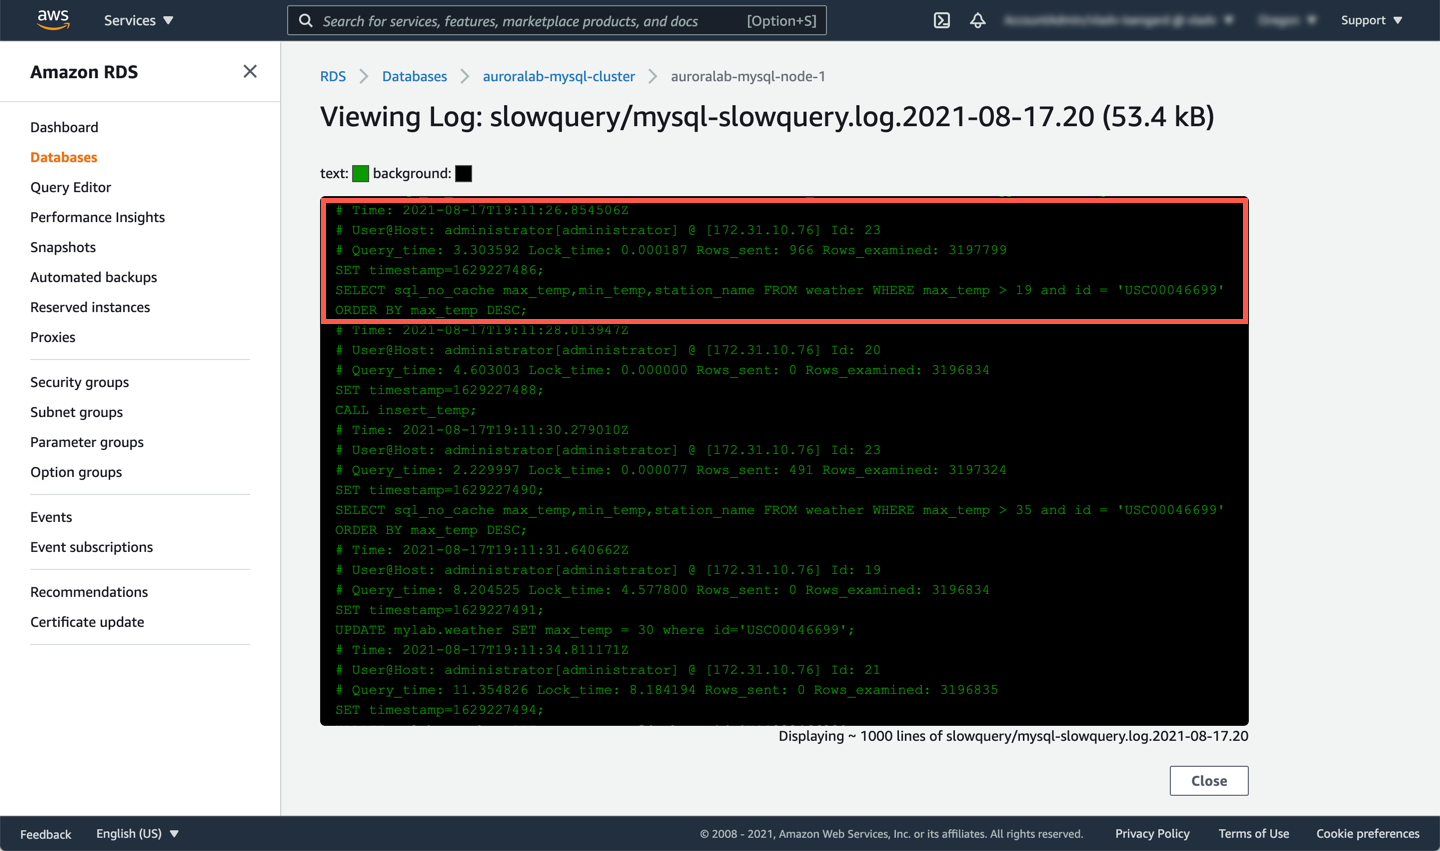
You should see slow queries in the console. The log file will also include the following:
* `Query_time`: The statement execution time in seconds.
* `Lock_time`: The time to acquire locks in seconds.
* `Rows_sent`: The number of rows sent to the client.
* `Rows_examined`: The number of rows examined by the server layer (not counting any processing internal to storage engines).
To learn more about slow queries, please check the MySQL documentation.
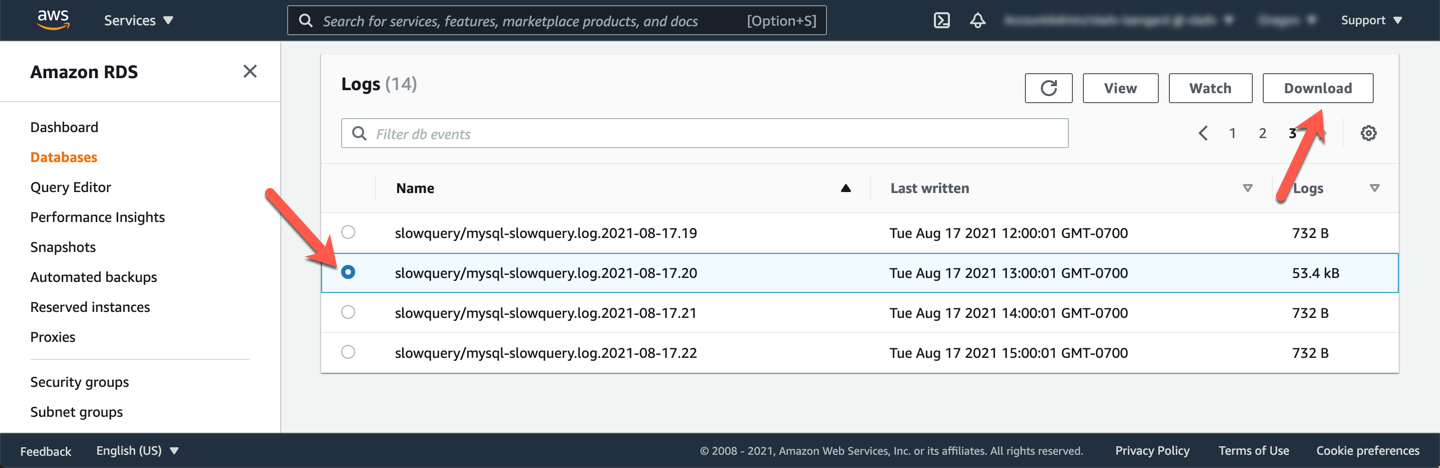
You can download slow query logs via the AWS Management Console or the AWS CLI using the download-db-log-file-portion API call. Use the Amazon RDS service console to locate the slow query log file that contains the desired events, and download that file by selectingb it and clicking **Download**. Rename the file to `slow_query_log1.log` and save the file to a memorable location.
## 8. Leverage Amazon CloudWatch Logs and Log Insights to view and analyze slow queries
Slow logs are great for troubleshooting, but viewing or downloading individual logs could be tedious and time consuming. In addition to viewing and downloading DB instance logs from the console, you can **publish logs** to Amazon CloudWatch Logs. With CloudWatch Logs, you can perform real-time analysis of the log data, store and retain the data in highly durable storage, and manage the data with the CloudWatch Logs Agent. Your DB cluster has already been configured to publish **error logs** and **slow query logs** to CloudWatch Logs.
To verify that your DB cluster is publishing logs, Open the Amazon RDS service console at the cluster detail page, and check the **Published logs** section of the **Configuration** tab. Please proceed to the next tasks only if you see slow query log publication enabled.
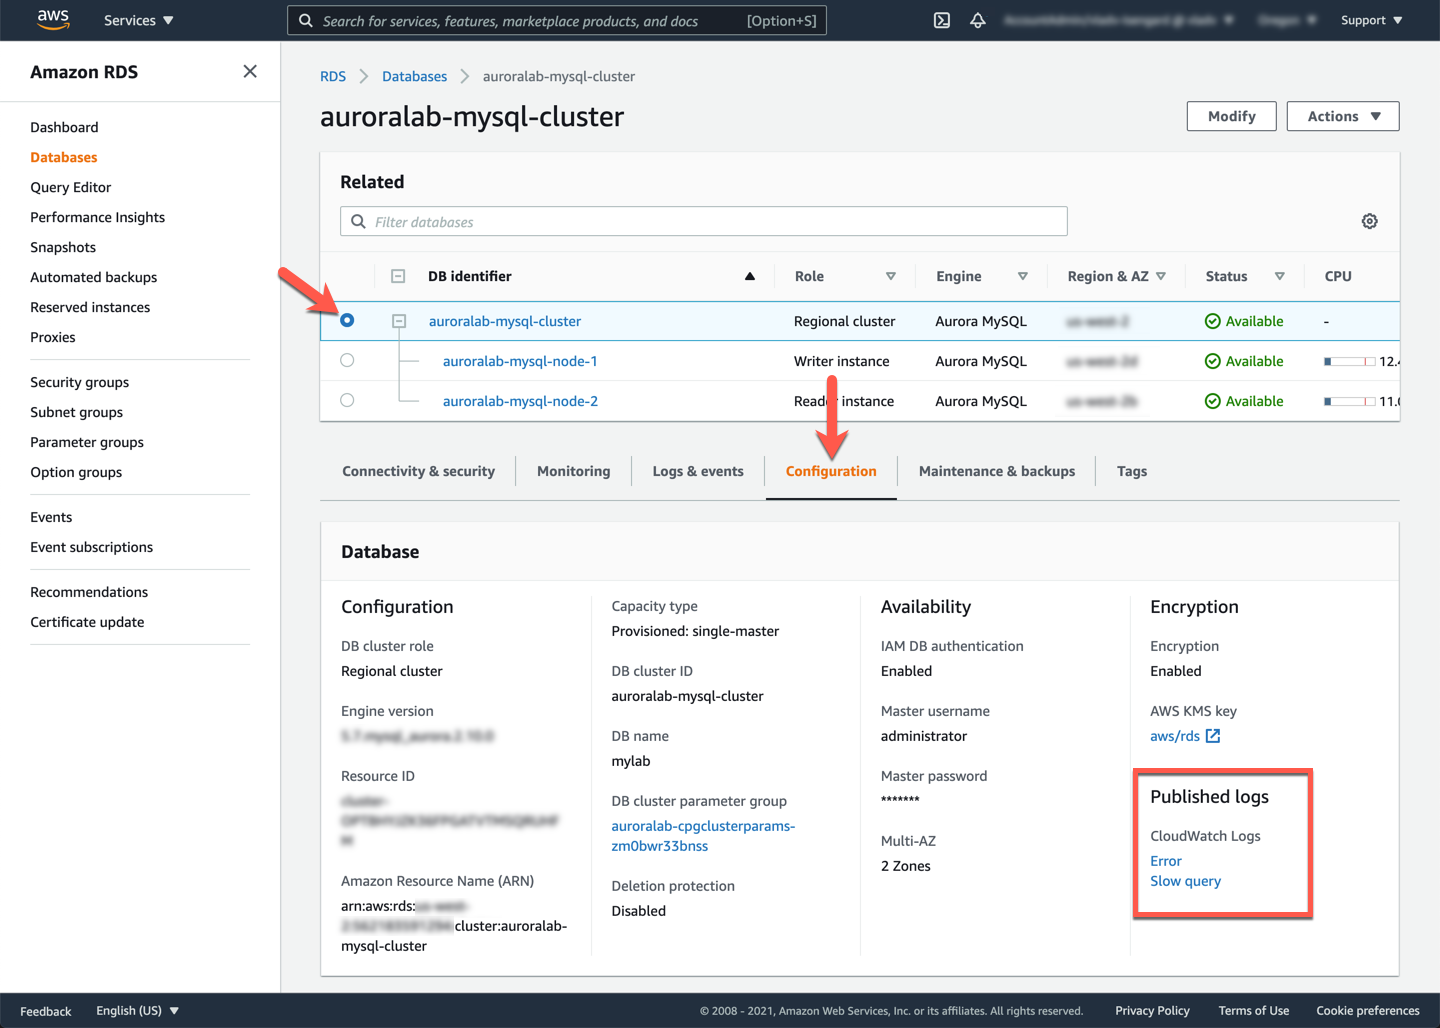
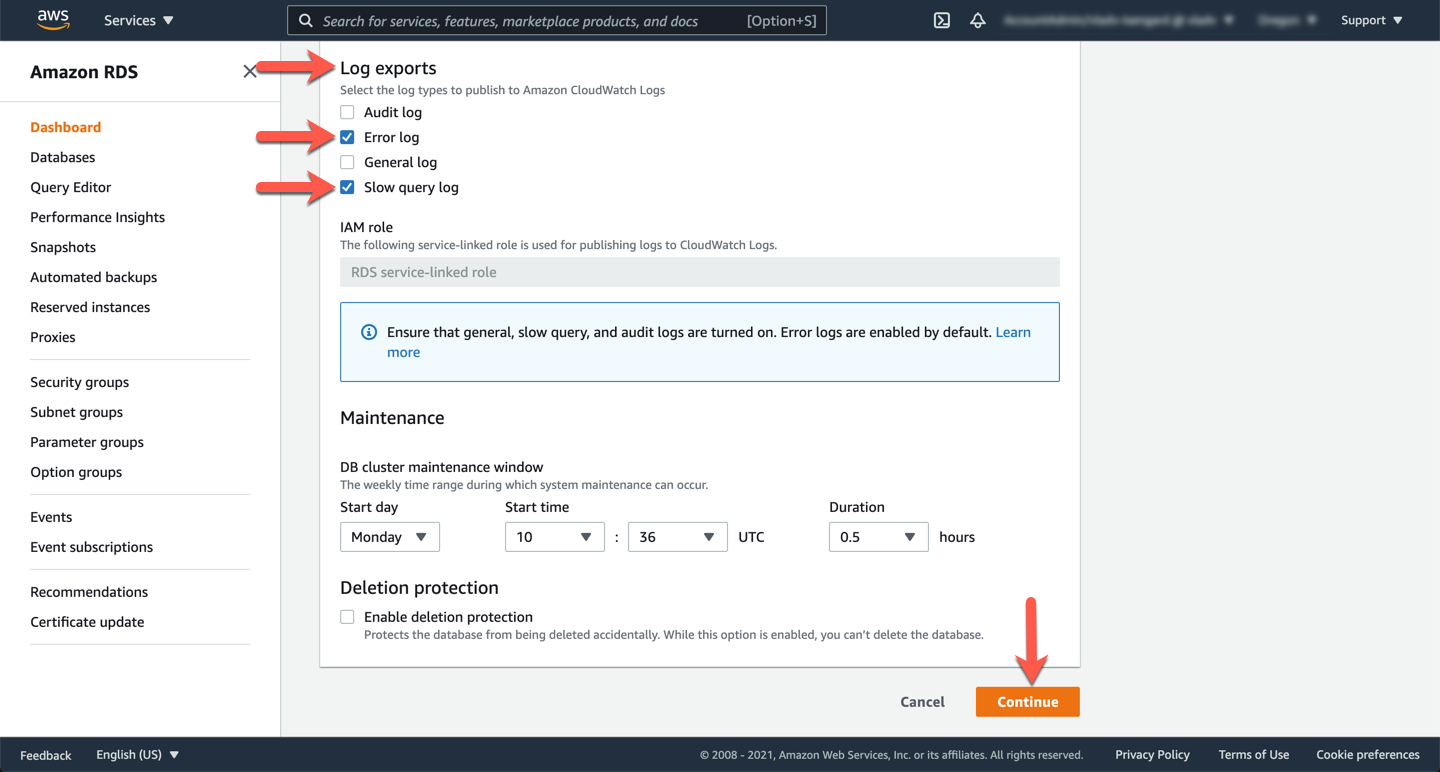
??? note "Enabling log publishing to Cloudwatch Logs"
To enable/disable these logs or add additional logs, you can click **Modify** on the top right of the panel → **Log exports** → check/uncheck preferred logs → **Continue** → **Modify cluster**.
Once you have verified that log exports are configured correctly, you can access the logs in CloudWatch Logs. A new log group is automatically created for the Aurora DB cluster under the following prefix, in which ==[cluster-name]== represents the DB cluster name, and ==[log_type]== represents the log type.
```
/aws/rds/cluster/[cluster-name]/[log_type]
```
For the DB cluster `auroralab-mysql-cluster`, slow query data is stored in the `/aws/rds/cluster/auroralab-mysql-cluster/slowquery` log group. Open the Amazon CloudWatch service console at the DB cluster log group.
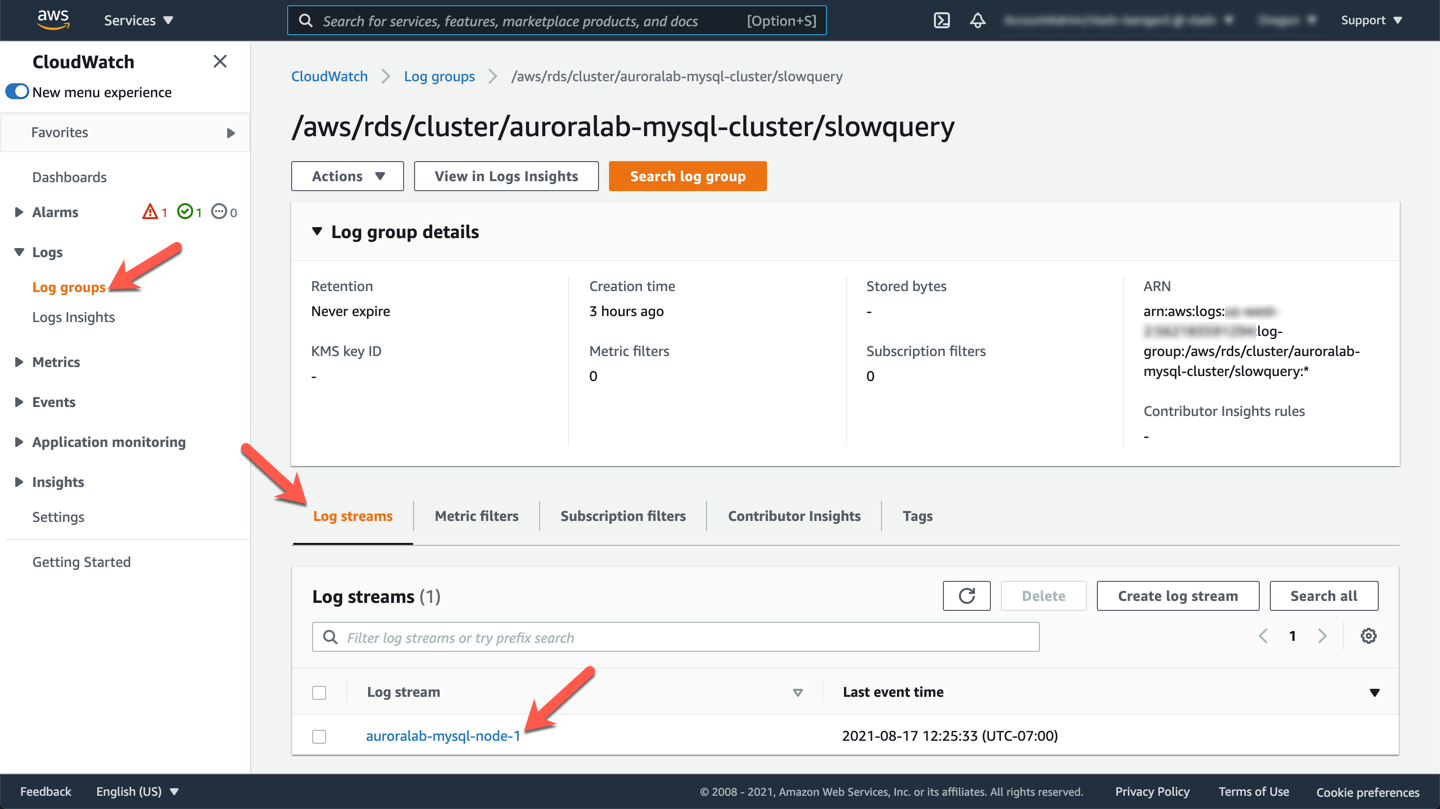
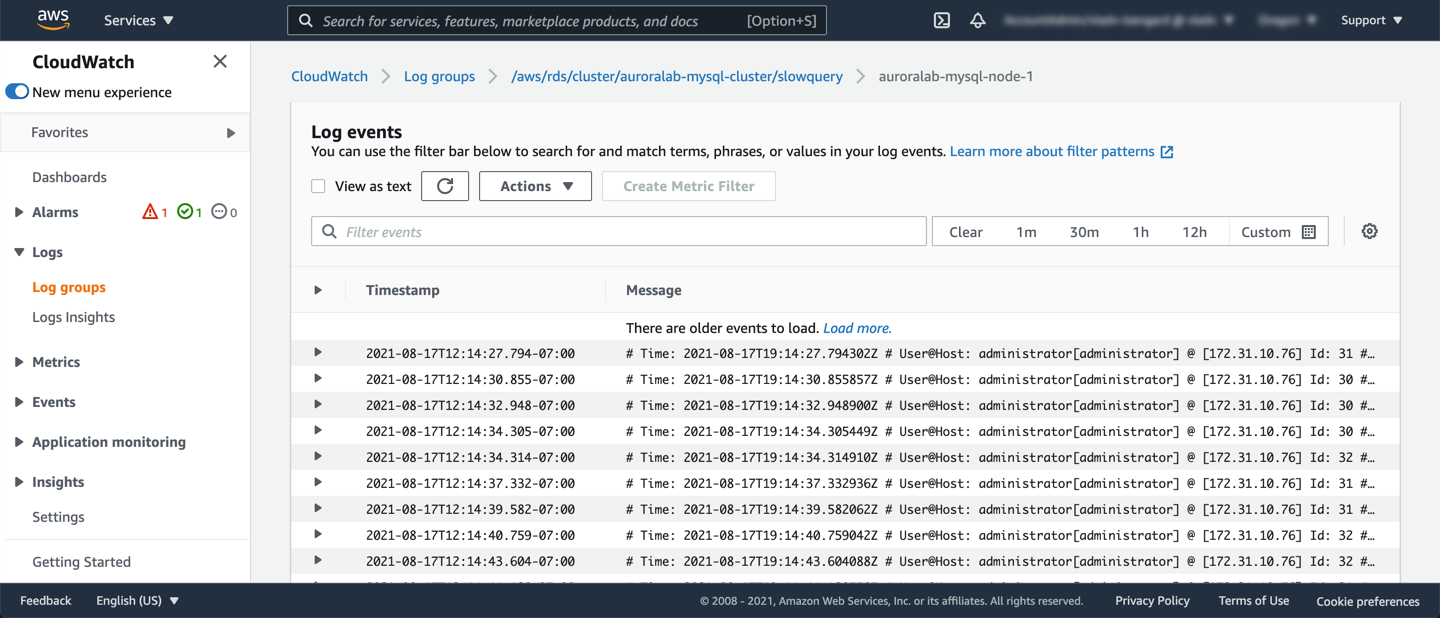
Under the **Log streams** tab, pick your current **writer** node (since that is where the workload was ran against) to view the slow query logs and you should see output similar to the example below:
!!! tip "Log retention in CLoudWatch Logs"
The default log retention period is `Never Expire`, however this can be changed. Please see Change log data retention in CloudWatch Logs in the documentation.
To increase the readability of these logs, you are going to use Amazon CloudWatch Insights. Click on the **Log Insights** option in the sidebar menu and select your log group in the drop down list. For slow queries, it will be `/aws/rds/cluster/auroralab-mysql-cluster/slowquery`. In the text field, enter the following insights query by replacing the ==[writerNode]== placeholder with the database instance ID (name) of your active writer node in the cluster:
```shell
filter @logStream = '[writerNode]'
| parse @message "# Time: * User@Host: * Id: * Query_time: * Lock_time: * Rows_sent: * Rows_examined: * timestamp=*;*" as Time, User, Id, Query_time, Lock_time, Rows_sent, Rows_examined, Timestamp, Query
| display Time, Query_time, Query, Rows_sent, Rows_examined
| sort Query_time asc
```
This query parses the slow query logs and captures the individual fields like `Time`, `Query_time`, `Query`, `Rows_sent`, `Rows_examined`. Once entered click **Run query**. The output should look similar to the example below.
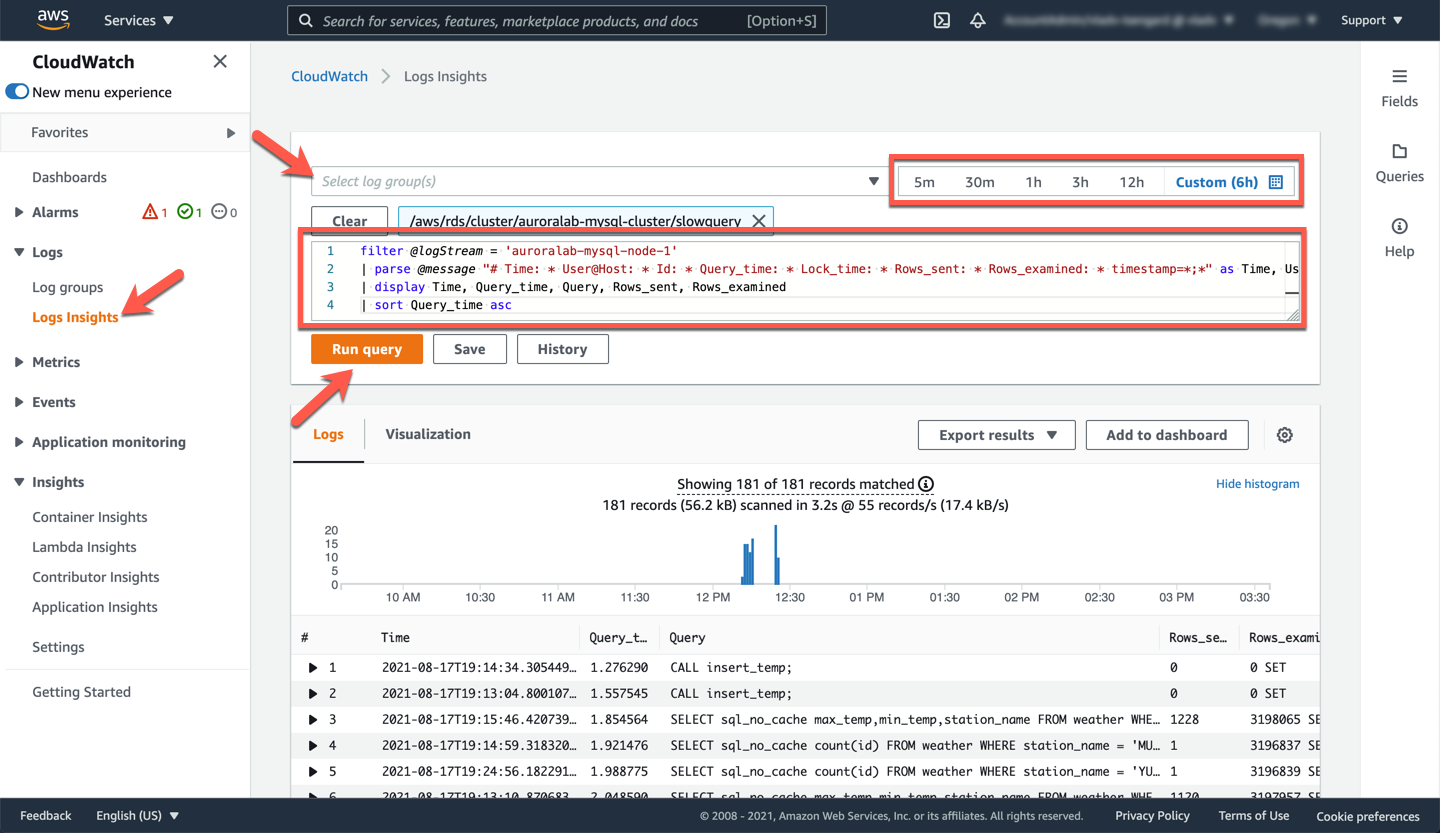
Only the queries that take longer than the parameter value of `long_query_time` (see above) will be listed. You can select any query and expand to find more information about it.
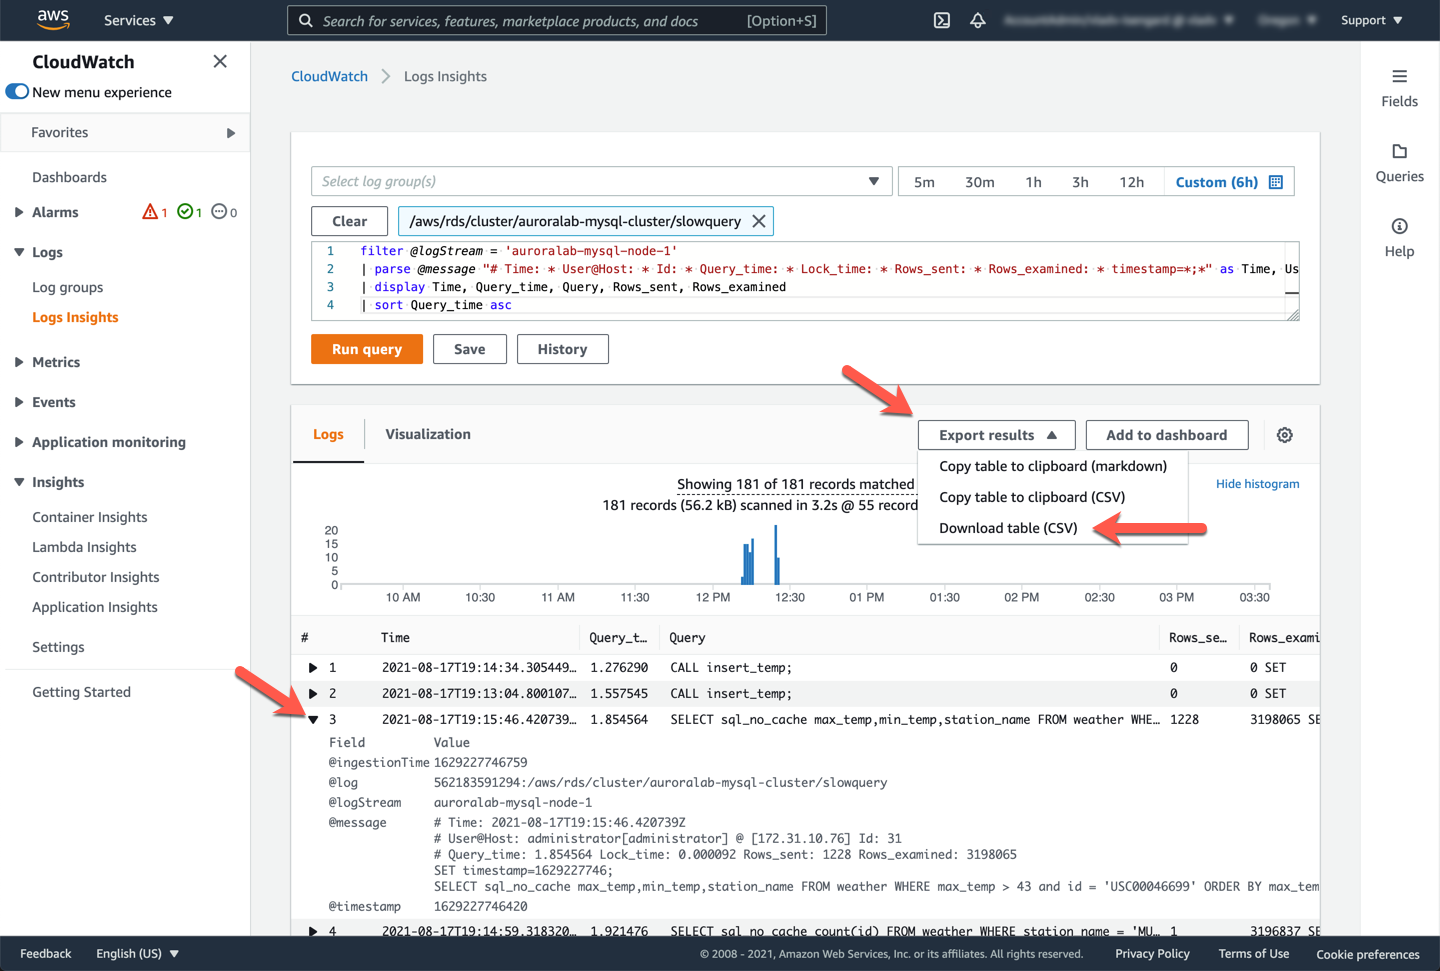
You can also export the results to a CSV-formatted file for easier analysis. Click "Export results** and choose **Download table (CSV)**. Name the resulting file `slow_query_log2.csv` and save it in a memorable location.
## 9. Optional: Process slow query logs with Percona's pt-query-digest
Normally, some amount of manual or automation effort is needed to find unique query patterns from the slow query logs, and such work scales poorly when you are operating many databases. In order to find the unique queries, there are several third party tools that can help, and one of them is **pt-query-digest**, part of the Percona Toolkit.
!!! note "Disclaimer"
Percona pt-query-digest is a third party software licensed under GNU so please use official documentation for reference.
**pt-query-digest** analyzes MySQL queries from slow, general, and binary log files. It summaries the top queries based on the input log file, ranked by response time. To save time and complexity, we have already installed this tool in your lab environment. You can learn more and find installation instructions on the Percona Toolkit website.
First, you need to download the **slow query logs** from the database instance (similar to the steps you took previously using the console).
??? note "Why can't I use the file i have already downloaded?"
In task **7. Download slow query logs** above, you have used the Amazon RDS service console to download a slow query log file. However, that file has been downloaded using a web browser to your local computer. You will need to process slow query log files using pt-query-digest using your Cloud9 desktop instead.
In the terminal window of your Cloud9 desktop, end the execution of the workload if it is still running, by typing `Ctrl+c`. Then run the following command by replacing the ==[writerNode]== placeholder with the database instance ID (name) of your active writer node in the cluster and ==[slowLogFileName]== placeholder with the correct slow log file name containing the desired events (the same file you viewed above in task **7. Download slow query logs**).
```
aws rds download-db-log-file-portion --db-instance-identifier [writerNode] --starting-token 0 --output text --log-file-name slowquery/[slowLogFileName] > slow_log_file.log
```
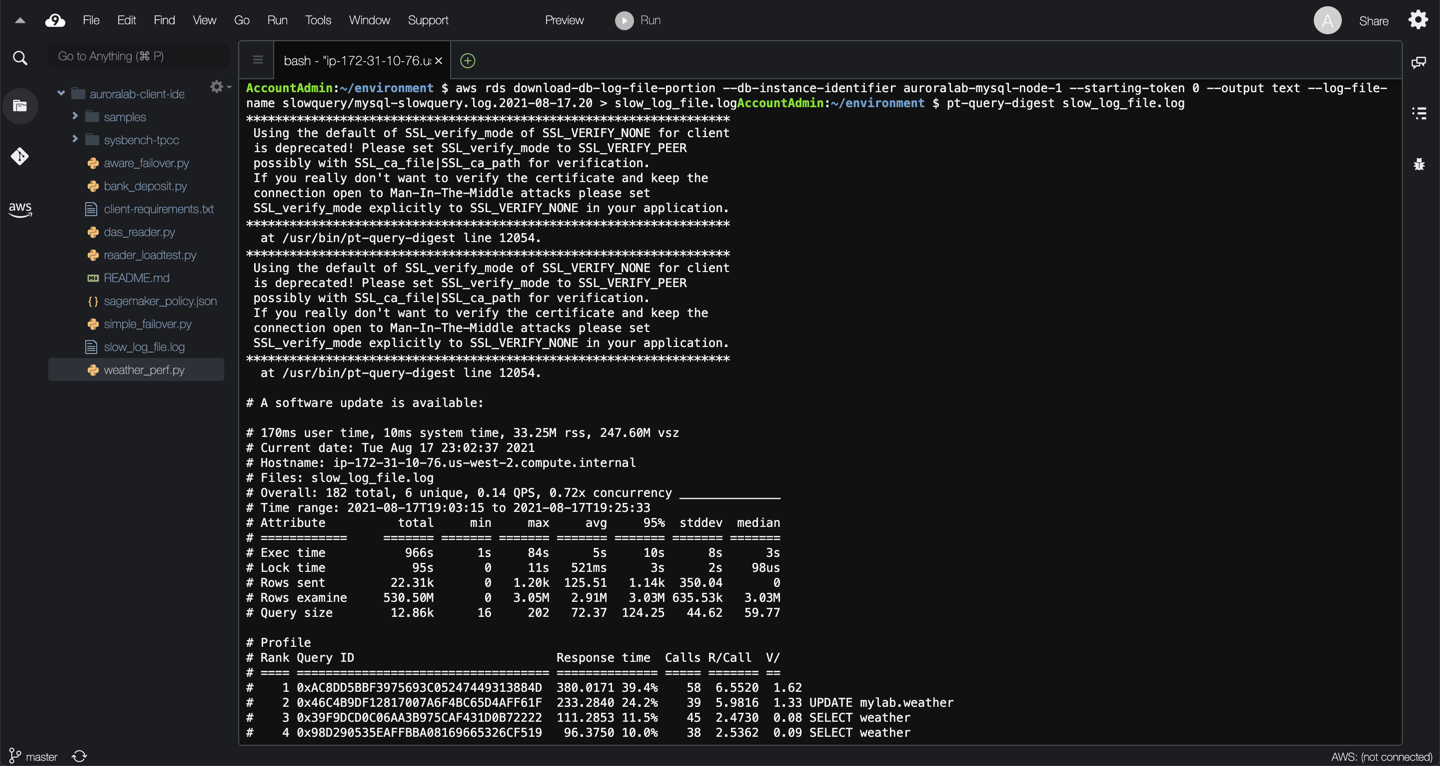
Once downloaded, you can run the pt-query-digest like below using the slow query log file you have just downloaded. Please ensure the log file name is correct, based on the file you .
```
pt-query-digest slow_log_file.log
```
This is a highly summarized view of the unique events in the detailed query report that follows. It contains the following columns and ranks the top slow running queries for readability:
```shell
Column Meaning
============ ==========================================================
Rank The query's rank within the entire set of queries analyzed
Query ID The query's fingerprint
Response time The total response time, and percentage of overall total
Calls The number of times this query was executed
R/Call The mean response time per execution
V/M The Variance-to-mean ratio of response time
Item The distilled query
```
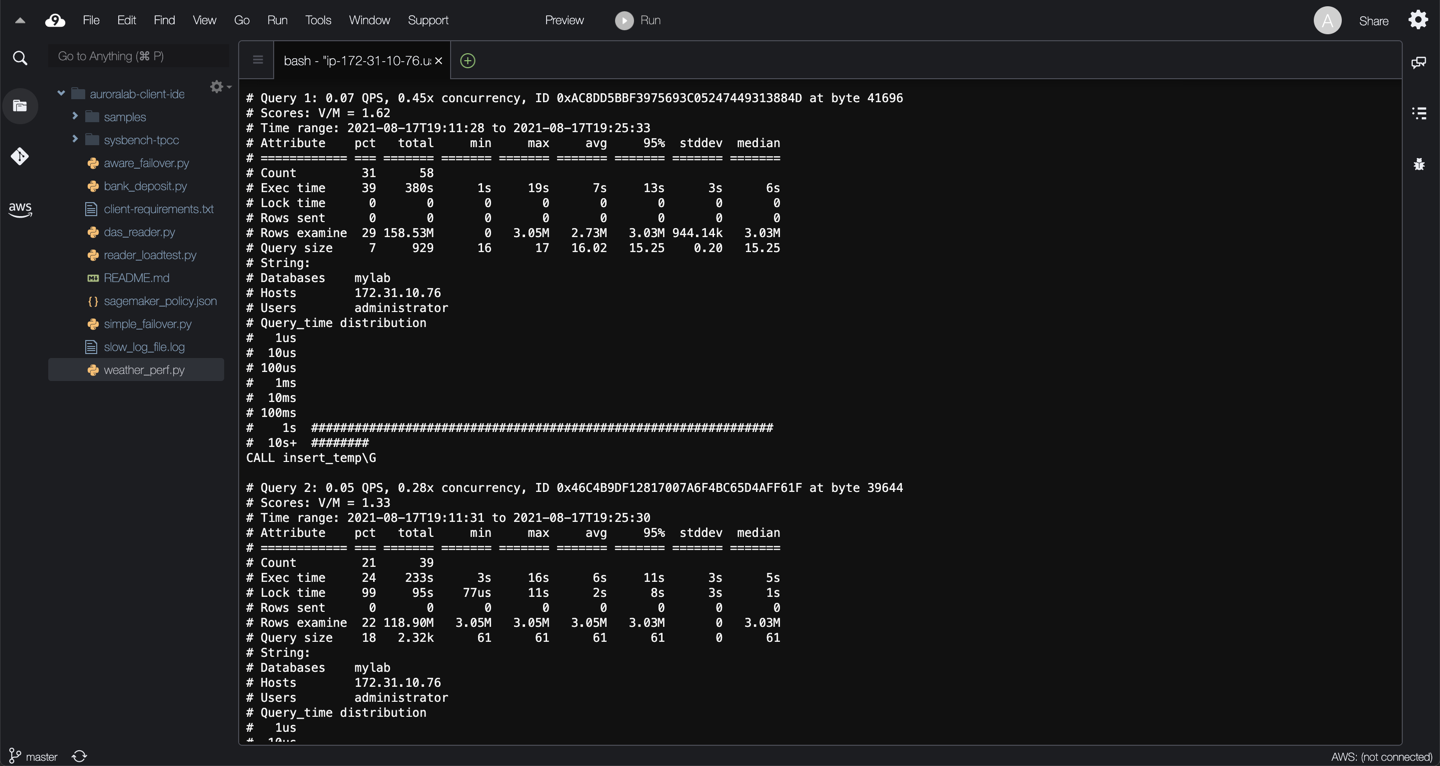
For the queries listed above in the previous section, this section contains individual metrics about each query ID with stats like `concurrency` calculated as a function of the timespan and total `Query_time`, `exec time`, `rows sent`, `rows examine` etc. This also provides the number of occurrences of a query in the slow log. You can collect these slow logs in a file and call them as `slow_query_log3`.
## 10. Summary
In this exercise you have used:
* RDS monitoring tools like CloudWatch Metrics, Enhanced Monitoring to understand the database workload.
* RDS performance monitoring tools like Performance Insights and its counters to understand the workload.
* MySQL slow query logs using RDS console, AWS CLI, CloudWatch Log Insights and Percona Toolkit's pt-query-digest to understand the pattern of queries.
In the next lab you will learn what to do with the captured slow query logs to [Analyze SQL Query Performance](/provisioned/perf-analysis/).