# Run workload and observe scaling
This lab will demonstrate how Aurora Serverless v2 performs scaling depending on the minimum and maximum ACU settings for the cluster.
This lab contains the following tasks:
1. Generate load on your DB cluster
2. Create CloudWatch dashboard
3. Examine the scaling of your DB cluster
This lab requires the following prerequisites:
* [Get Started](/prereqs/environment/)
* [Connect to the Cloud9 Desktop](/prereqs/connect/)
* [Create a new Aurora Serverless v2 DB Cluster](/serverlessv2/create/) (optional, only if you plan to create a cluster manually)
* [Gather cluster details](/serverlessv2/clusterdetails/)
## 1. Generate load on your DB cluster
=== "The DB cluster was pre-created for me"
We will use a python script to generate load on the Aurora Serverless v2 cluster. If you have not already opened a terminal window in the Cloud9 desktop in a previous lab, please [follow these instructions](/prereqs/connect/) to do so now. Once connected, run the load generation script from the terminal window, replacing the [clusterEndpoint] placeholder with your Aurora Serverless v2 **cluster endpoint** you noted down in the [previous section](/serverlessv2/clusterdetails/).
```
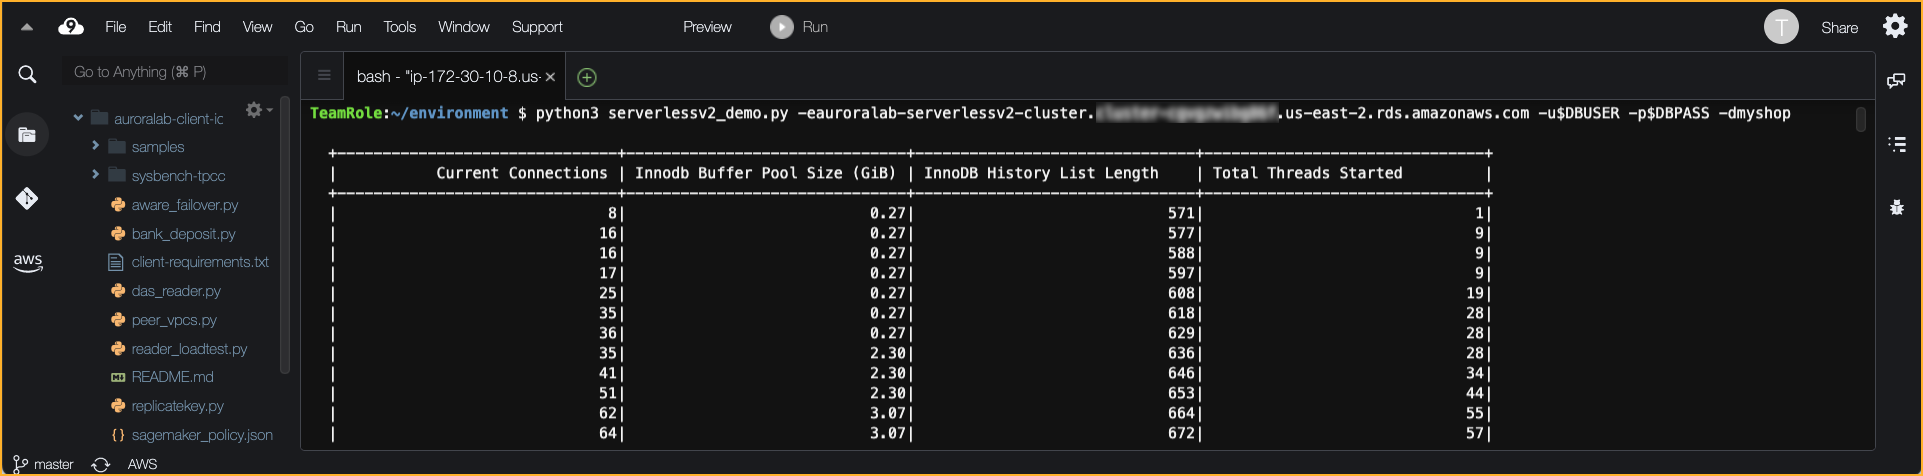
python3 serverlessv2_demo.py -e[clusterEndpoint] -u$DBUSER -p$DBPASS -dmyshop
```
After the command is executed with the correct cluster endpoint, it will report the number of current connections, total threads initiated with the database and it will also show the Innodb Buffer Pool Size, InnoDB History List Length growing with the number of connections.
=== "I created the DB cluster myself"
We will use a python script to generate load on the Aurora Serverless v2 cluster. If you have not already opened a terminal window in the Cloud9 desktop in a previous lab, please [follow these instructions](/prereqs/connect/) to do so now. Once connected, run the load generation script from the terminal window, replacing the [clusterEndpoint] placeholder with your Aurora Serverless v2 **cluster endpoint** you noted down in the [previous section](/serverlessv2/clusterdetails/).
You will also have to replace the **Username** and **Password** in the following command. You created username and password during the cluster creation.
```
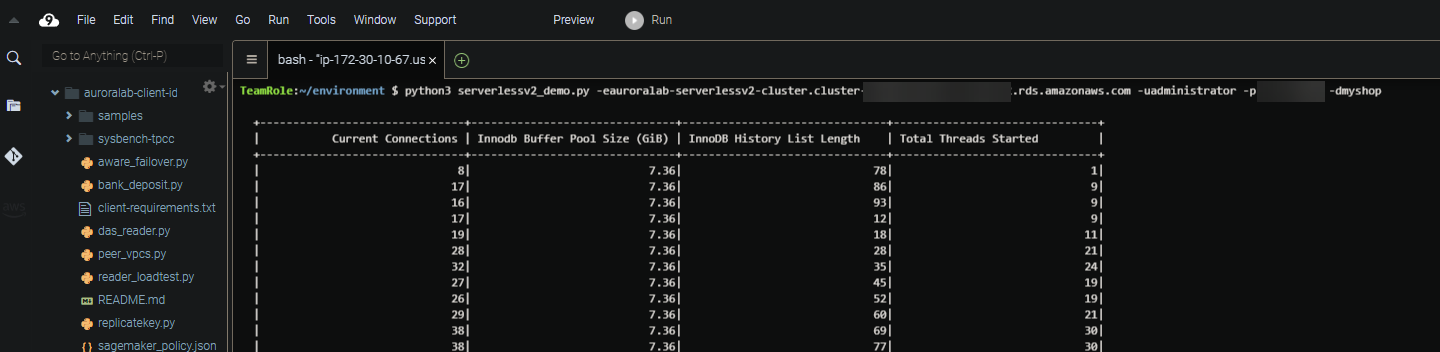
python3 serverlessv2_demo.py -e[clusterEndpoint] -uUsername -pPassword -dmyshop
```
After the command is executed with the correct cluster endpoint, it will report the number of current connections, total threads initiated with the database and it will also show the Innodb Buffer Pool Size, InnoDB History List Length growing with the number of connections.
## 2. Create CloudWatch dashboard
While the command is running, open the Amazon CloudWatch console in a different browser tab.
!!! warning "Region Check"
Ensure you are still working in the correct region, especially if you are following the links above to open the service console at the right screen.
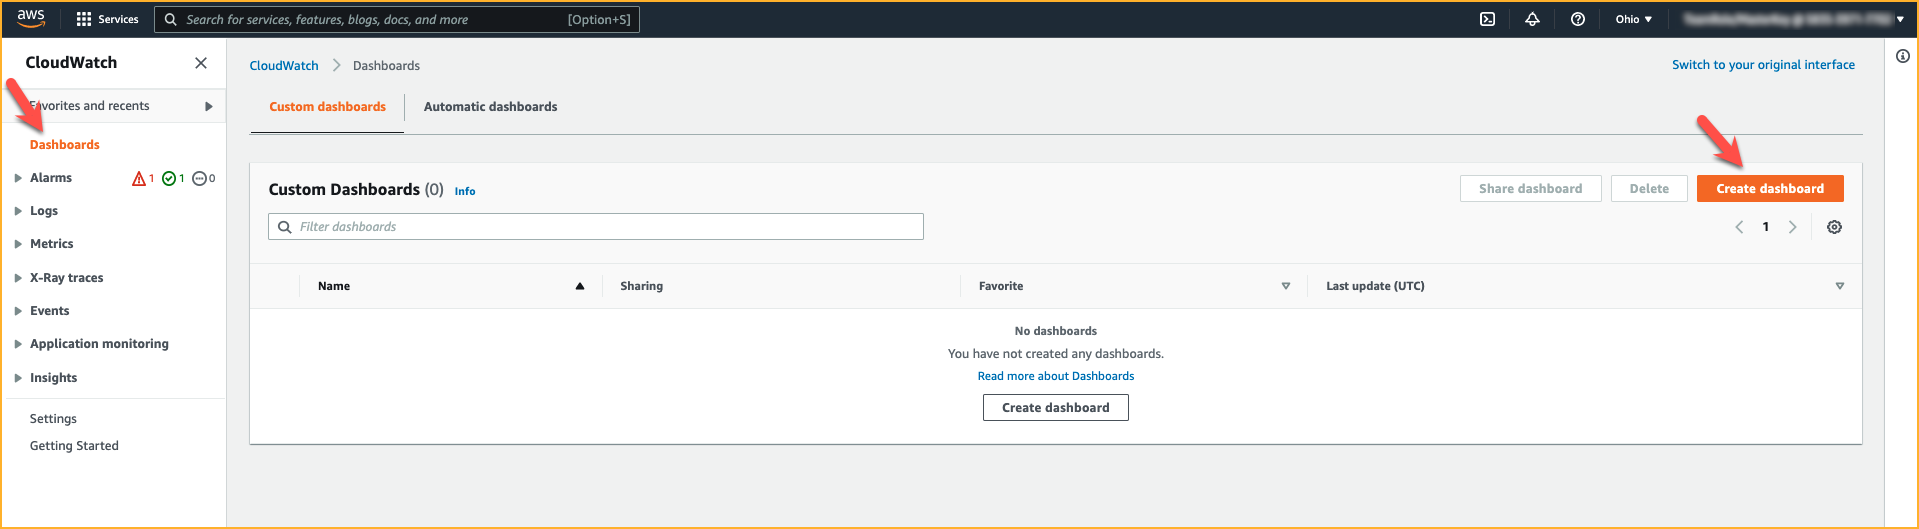
In the navigation pane, choose **Dashboards**, and then choose **Create dashboard**. In the Create new dashboard dialog box, enter name `aurora-serverless-v2` for the dashboard, and then choose **Create dashboard**.
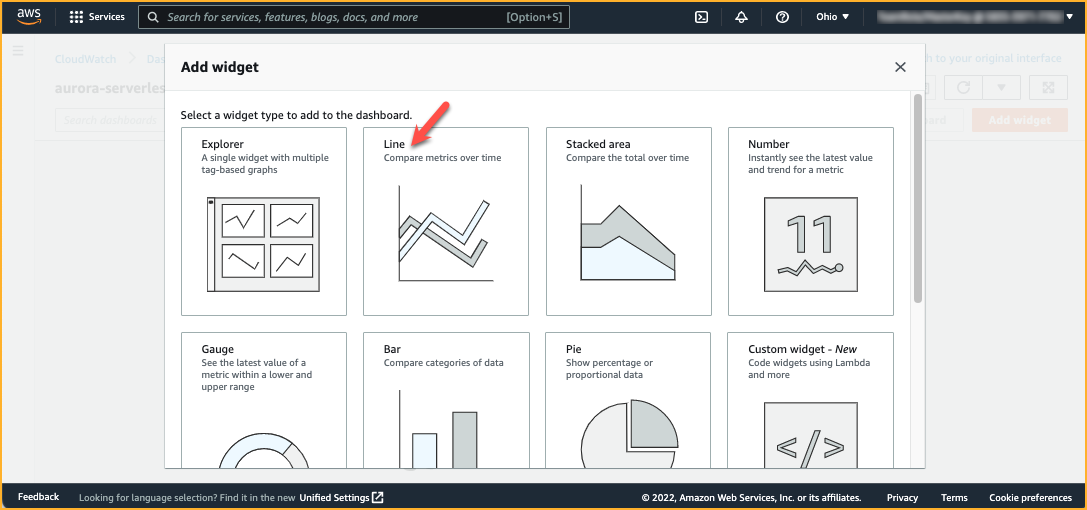
In the **Add Widget** dialog box, select **Line**.
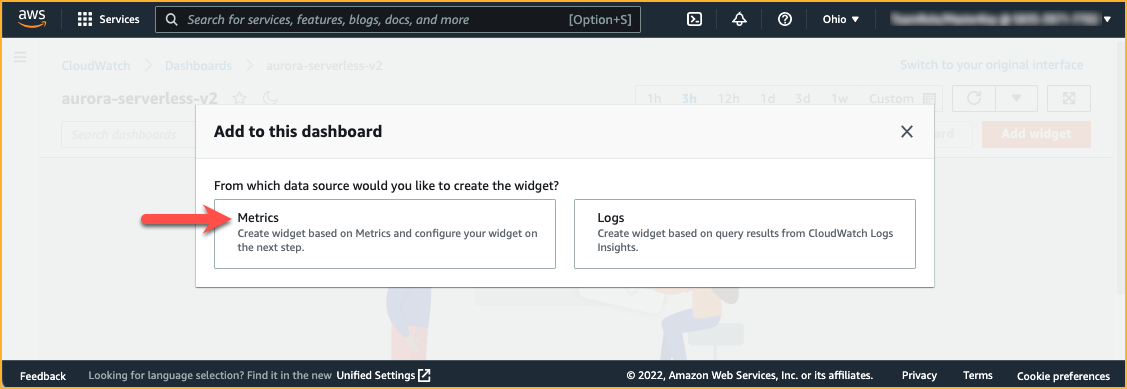
Next, in the **Add to this dashboard** dialog box, choose **Metrics**.
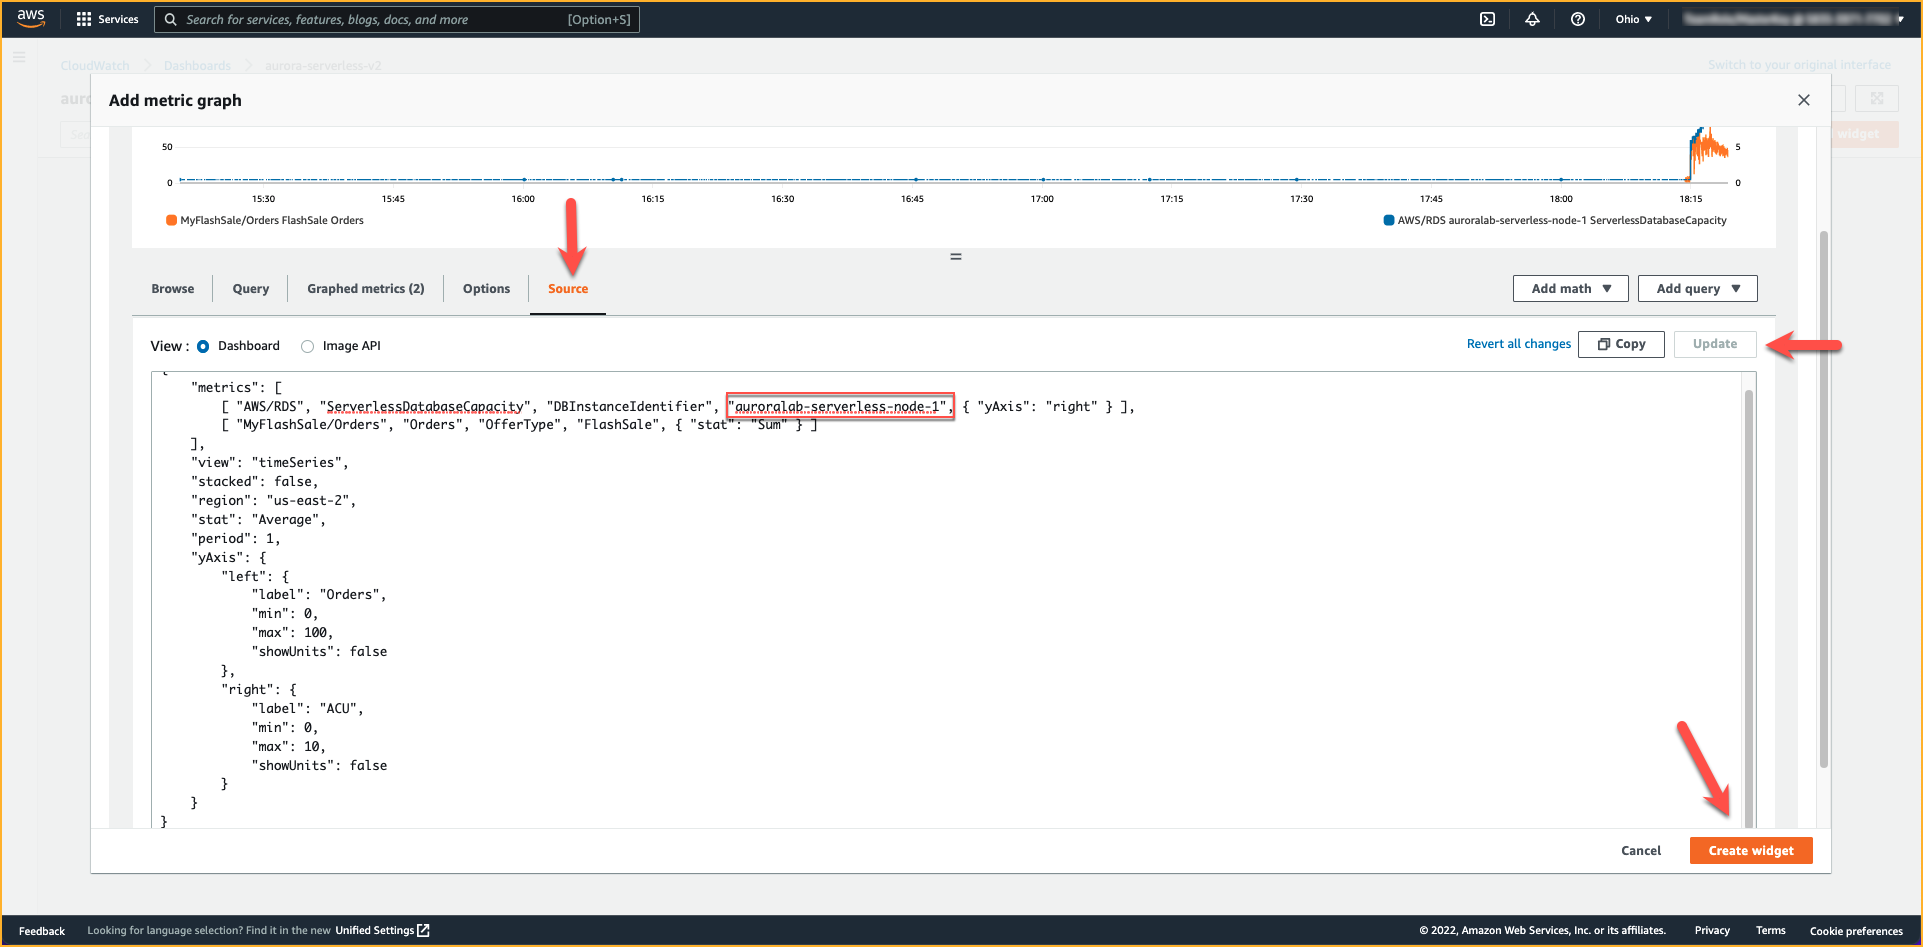
In the **Add metric graph** dialog box, choose **Source** and paste the below code after making the following changes:
1. Replace `[WriterInstanceName]` with the name of your cluster writer instance, which you gathered in the [previous section](/serverlessv2/clusterdetails/).
2. Replace `[regionname]` with your current region (example: us-east-2).
{
"metrics": [
[ "AWS/RDS", "ServerlessDatabaseCapacity", "DBInstanceIdentifier", "[WriterInstanceName]", { "yAxis": "right" } ],
[ "MyFlashSale/Orders", "Orders", "OfferType", "FlashSale", { "stat": "Sum" } ]
],
"view": "timeSeries",
"stacked": false,
"region": "[regionname]",
"stat": "Average",
"period": 1,
"yAxis": {
"left": {
"label": "Orders",
"min": 0,
"max": 100,
"showUnits": false
},
"right": {
"label": "ACU",
"min": 0,
"max": 10,
"showUnits": false
}
}
}
After making the changes to the region and writer instance name, paste the above code under the **Source** tab. Click on **Update** and then choose **Create widget** as shown in screenshot.
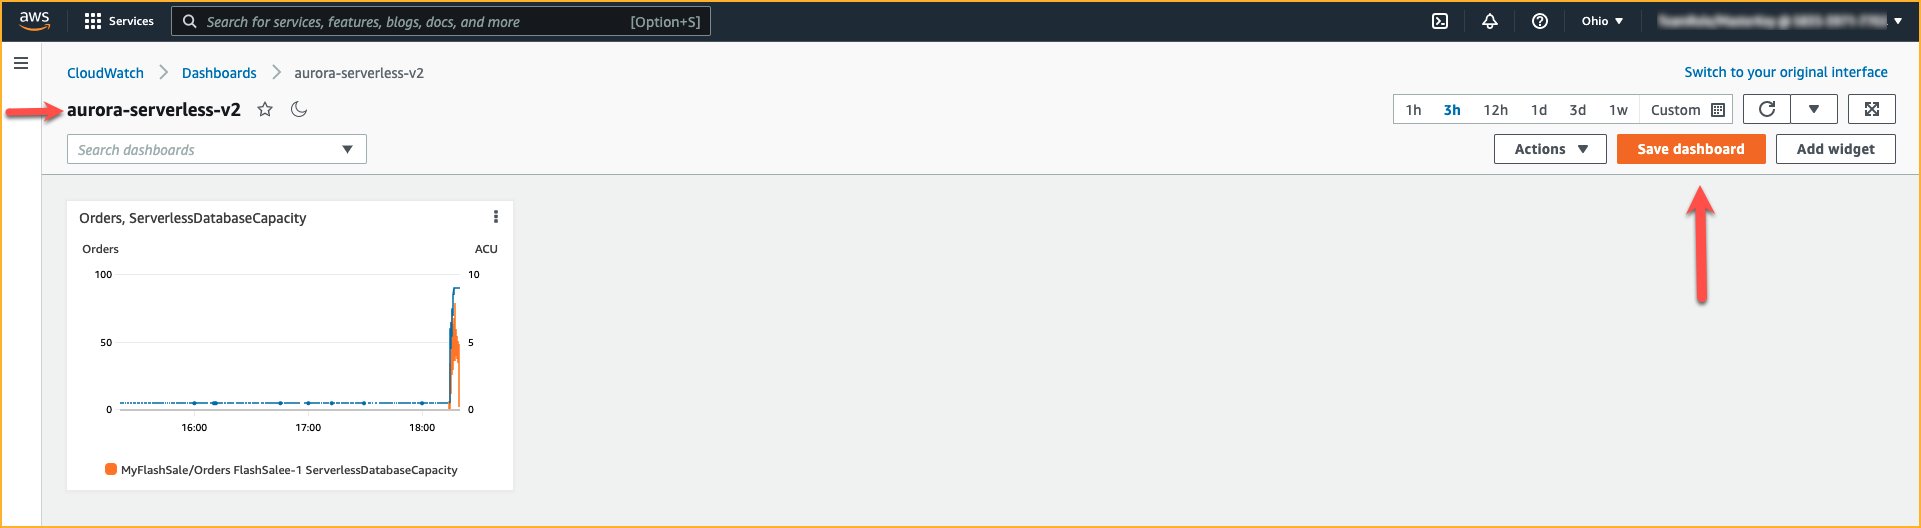
Finally, select **Save dashboard** on the top right corner.
## 3. Examine the scaling
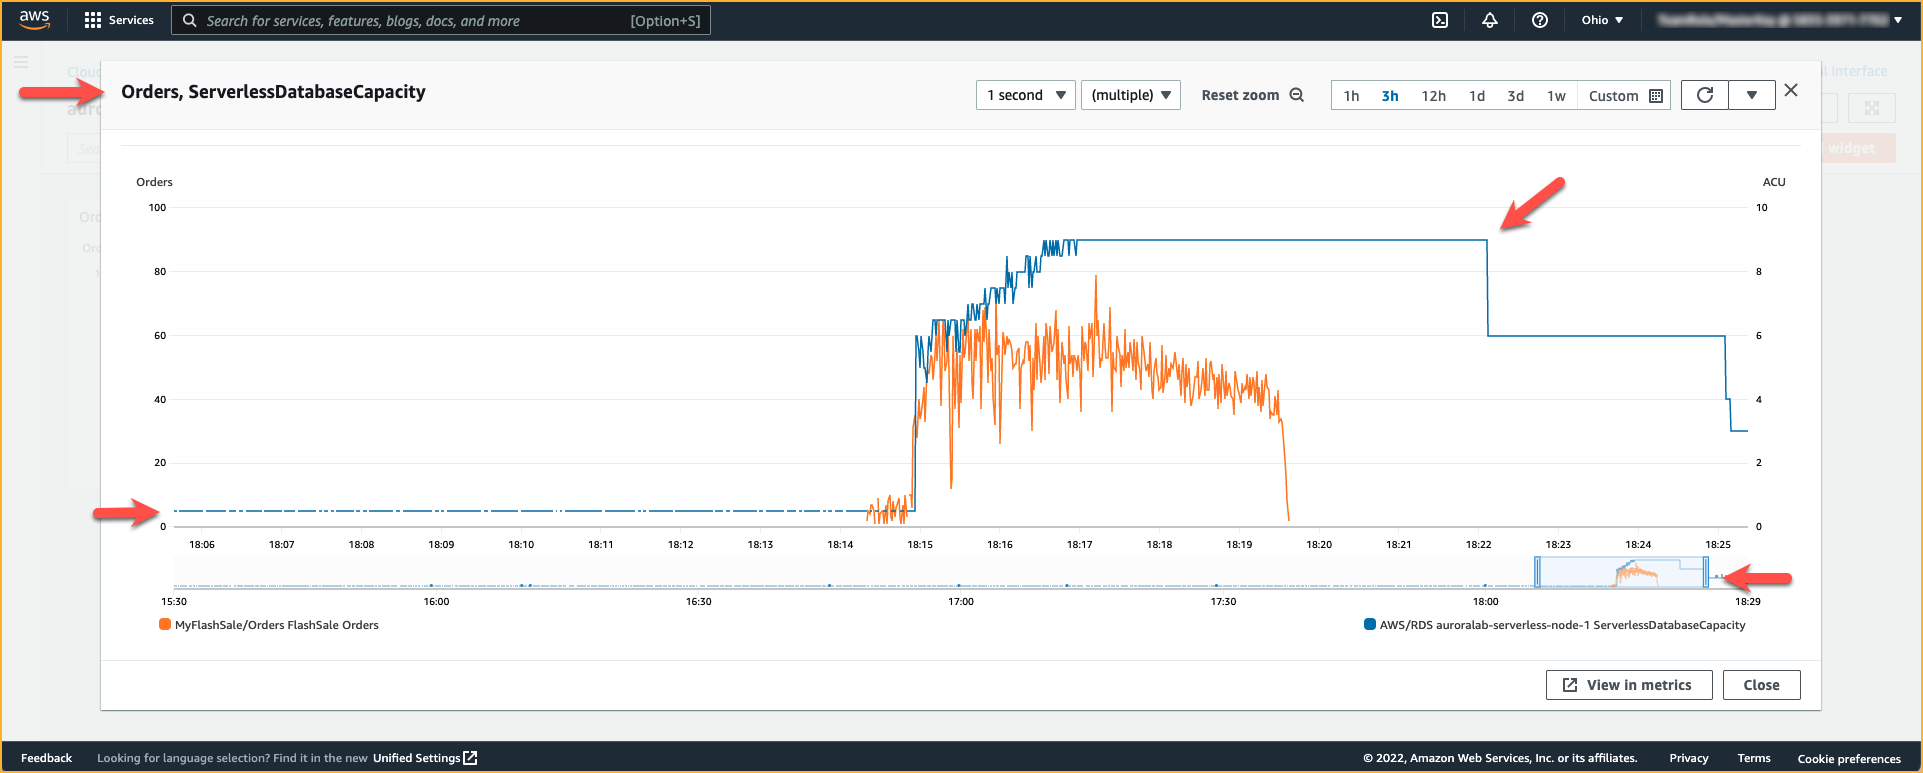
To expand the widget, hover on it and click on **Maximize** icon. You will be able to see a similar graph as shown below which is a plot of **Orders** vs **ACU - Aurora Capacity Unit**. The number of Orders (orange line) are graphed against the Aurora Serverless v2 database capacity (blue line). As can be seen in the graph, at the start of the workload, the Serverless v2 cluster is at the **Minimum ACUs** of 0.5, as the orders increased, the cluster scaled to the **Maximum ACUs** of 9 and as the orders decreased the capacity would continue to scale down.
The metrics displayed on the dashboard are a moving time window. You can adjust the size of the time window by clicking the buttons across the top right of the interface (`1h`, `3h`, `12h`, `1d`, `Custom`). You can also zoom into a specific period of time by dragging across the graphs.
!!! note
All dashboard views are time synchronized, zooming into the graph will adjust all views.
You can now toggle back to the Cloud9 desktop terminal, and type `CTRL+C` to quit the load generator. After a while, the Aurora Serverless v2 cluster would scale to the **Minimum ACUs** of 0.5 automatically. While you are welcome to wait until that happens, you may also proceed with the next lab at this point.