# LAB 1: Serverless Amazon CloudFront Log Analysis Pipeline
* [Overview](#overview)
* [Log collection](#log-collection)
* [Lab Overview](#lab-overview)
* [Lambda @ Edge](#lambda--edge)
* [Pre-requisites](#pre-requisites)
* [Create Amazon S3 Bucket](#create-amazon-s3-bucket)
* [Creating Glue Data Catalog Database and Table using Amazon Athena](#creating-glue-data-catalog-database-and-table-using-amazon-athena)
* [Create Glue Data Catalog Database using Amazon Athena](#create-glue-data-catalog-database-using-amazon-athena)
* [Create Glue Data Catalog for CloudFront Access Logs in optimized Parquet Format](#create-glue-data-catalog-for-cloudfront-access-logs-in-optimized-parquet-format)
* [Create Glue Data Catalog for Application Load Balancer(ALB) Access Logs in optimized Parquet Format](#create-glue-data-catalog-for-application-load-balanceralb-access-logs-in-optimized-parquet-format)
* [Create Glue Data Catalog for Lambda@Edge Logs - Viewer Request in optimized Parquet Format](#create-glue-data-catalog-for-lambdaedge-logs---viewer-request-in-optimized-parquet-format)
* [Create Glue Data Catalog for Lambda@Edge Logs - Origin Request in optimized Parquet Format](#create-glue-data-catalog-for-lambdaedge-logs---origin-request-in-optimized-parquet-format)
* [Combine the logs using an AWS Glue ETL Job](#combine-the-logs-using-an-aws-glue-elt-job)
* [Create AWS IAM Role](#create-aws-iam-role)
* [Create AWS Glue ETL Job](#create-aws-glue-etl-job)
* [Combine the logs using an AWS Glue ETL Job](#combine-the-logs-using-an-aws-glue-etl-job)
* [(Optional)Create AWS Glue Data Catalog for the combined Lamabda@Eddge logs using Amazon Athena](#optional-create-aws-glue-data-catalog-for-the-combined-lamabdaeddge-logs-using-amazon-athena)
* [Create AWS Glue Data Catalog for the combined logs using Amazon Athena](#create-aws-glue-data-catalog-for-the-combined-logs-using-amazon-athena)
* [Visualization using Amazon QuickSight](#visualization-using-amazon-quicksight)
* [Signing Up for Amazon QuickSight Standard Edition](#signing-up-for-amazon-quicksight-standard-edition)
* [Configure Amazon S3 bucket Permission](#configure-amazon-s3-bucket-permission)
* [Configuring Amazon QuickSight to use Amazon Athena as data source](#configuring-amazon-quicksight-to-use-amazon-athena-as-data-source)
* [Generating new calculated fields in Amazon QuickSight](#generating-new-calculated-fields-in-amazon-quickSight)
* [Create new calculated fields “EdgeToOriginTimeTaken” in Amazon QuickSight](#create-new-calculated-fields-edgetoorigintimetaken-in-amazon-quicksight)
* [Create new calculated fields "HourOfDay" in Amazon QuickSight](#create-new-calculated-fields-hourofday-in-amazon-quicksight)
* [Create new calculated fields "TotalTimeTakenAtALB" in Amazon QuickSight](#create-new-calculated-fields-totaltimetakenatalb-in-amazon-quicksight)
* [Generate Visualization using Amazon QuickSight](#visualization-using-amazon-quicksight)
* [Generate visualization to status code by edge location](#generate-visualization-to-status-code-by-edge-location)
* [(Optional)Generate visualization to status code by URI](#optional-generate-visualization-to-status-code-by-uri)
* [Generate visualization to show hourly average time taken between edge and origin by country where the end user request originated from](#generate-visualization-to-show-hourly-average-time-taken-between-edge-and-origin-by-country-where-the-end-user-request-originated-from)
* [Generate visualization to show hourly average time taken (total Vs. edge to origin Vs. server-side processing) by country where the end user request originated from](#generate-visualization-to-show-hourly-average-time-taken-total-vs-edge-to-origin-vs-server-side-processing-by-country-where-the-end-user-request-originated-from)
* [(Optional)Generate visualization to show hourly average time taken (total Vs. edge to origin V.s server-side processing) by country where the end user request originated from for a different viewer country](#optional-generate-visualization-to-show-hourly-average-time-taken-total-vs-edge-to-origin-vs-server-side-processing-by-country-where-the-end-user-request-originated-from-for-a-different-viewer-country)
* [Generate Visualization to show product category request by country](#generate-visualization-to-show-product-category-request-by-country)
* [(Optional)Generate visualization to show device form factor ratio](#optional-generate-visualization-to-show-device-form-factor-ratio)
* [(Optional)Generate visualization to show device form factor ration by viewer country](#optional-generate-visualization-to-show-device-form-factor-ration-by-viewer-country)
---
---
## Overview
### Log collection
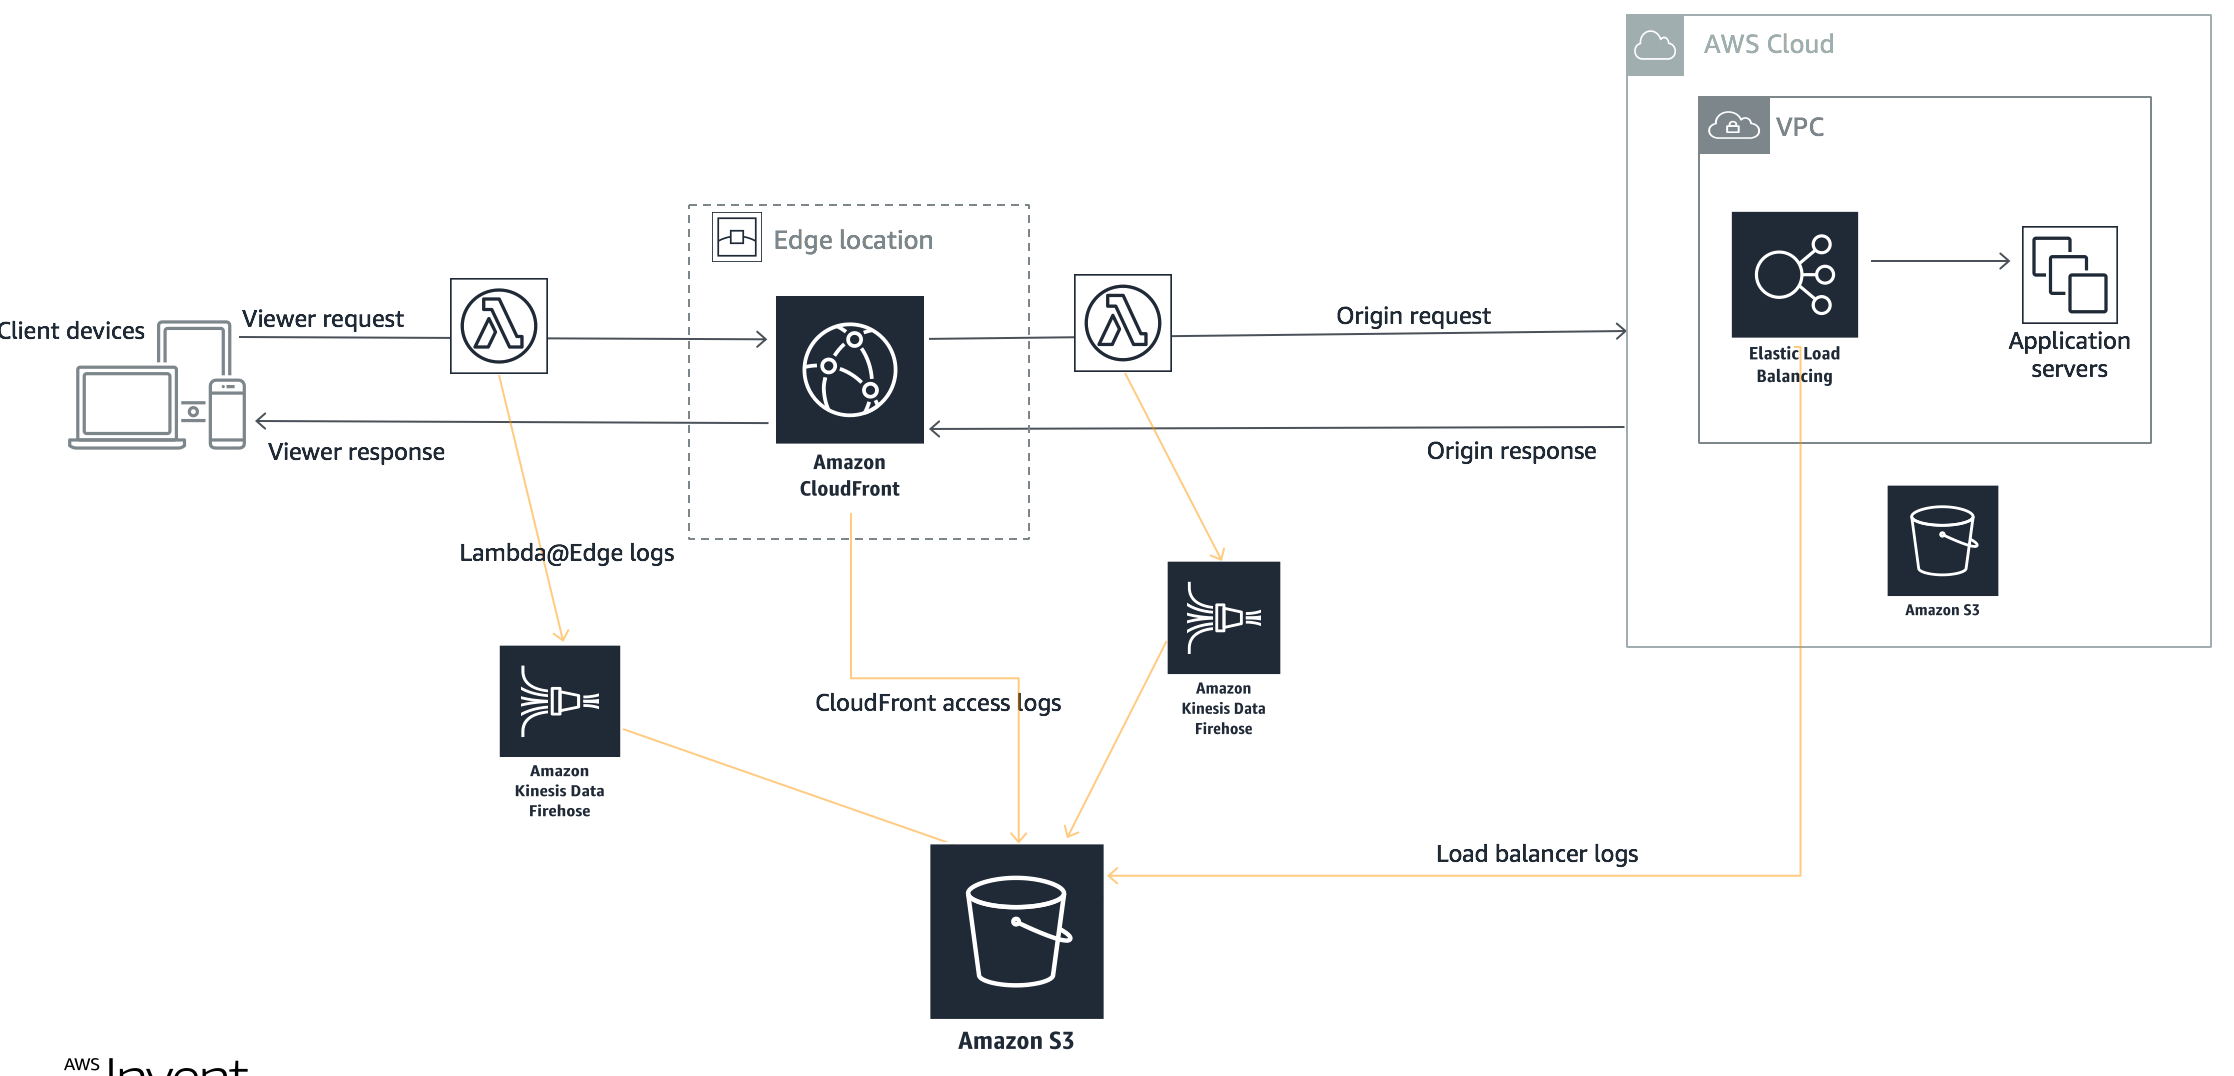
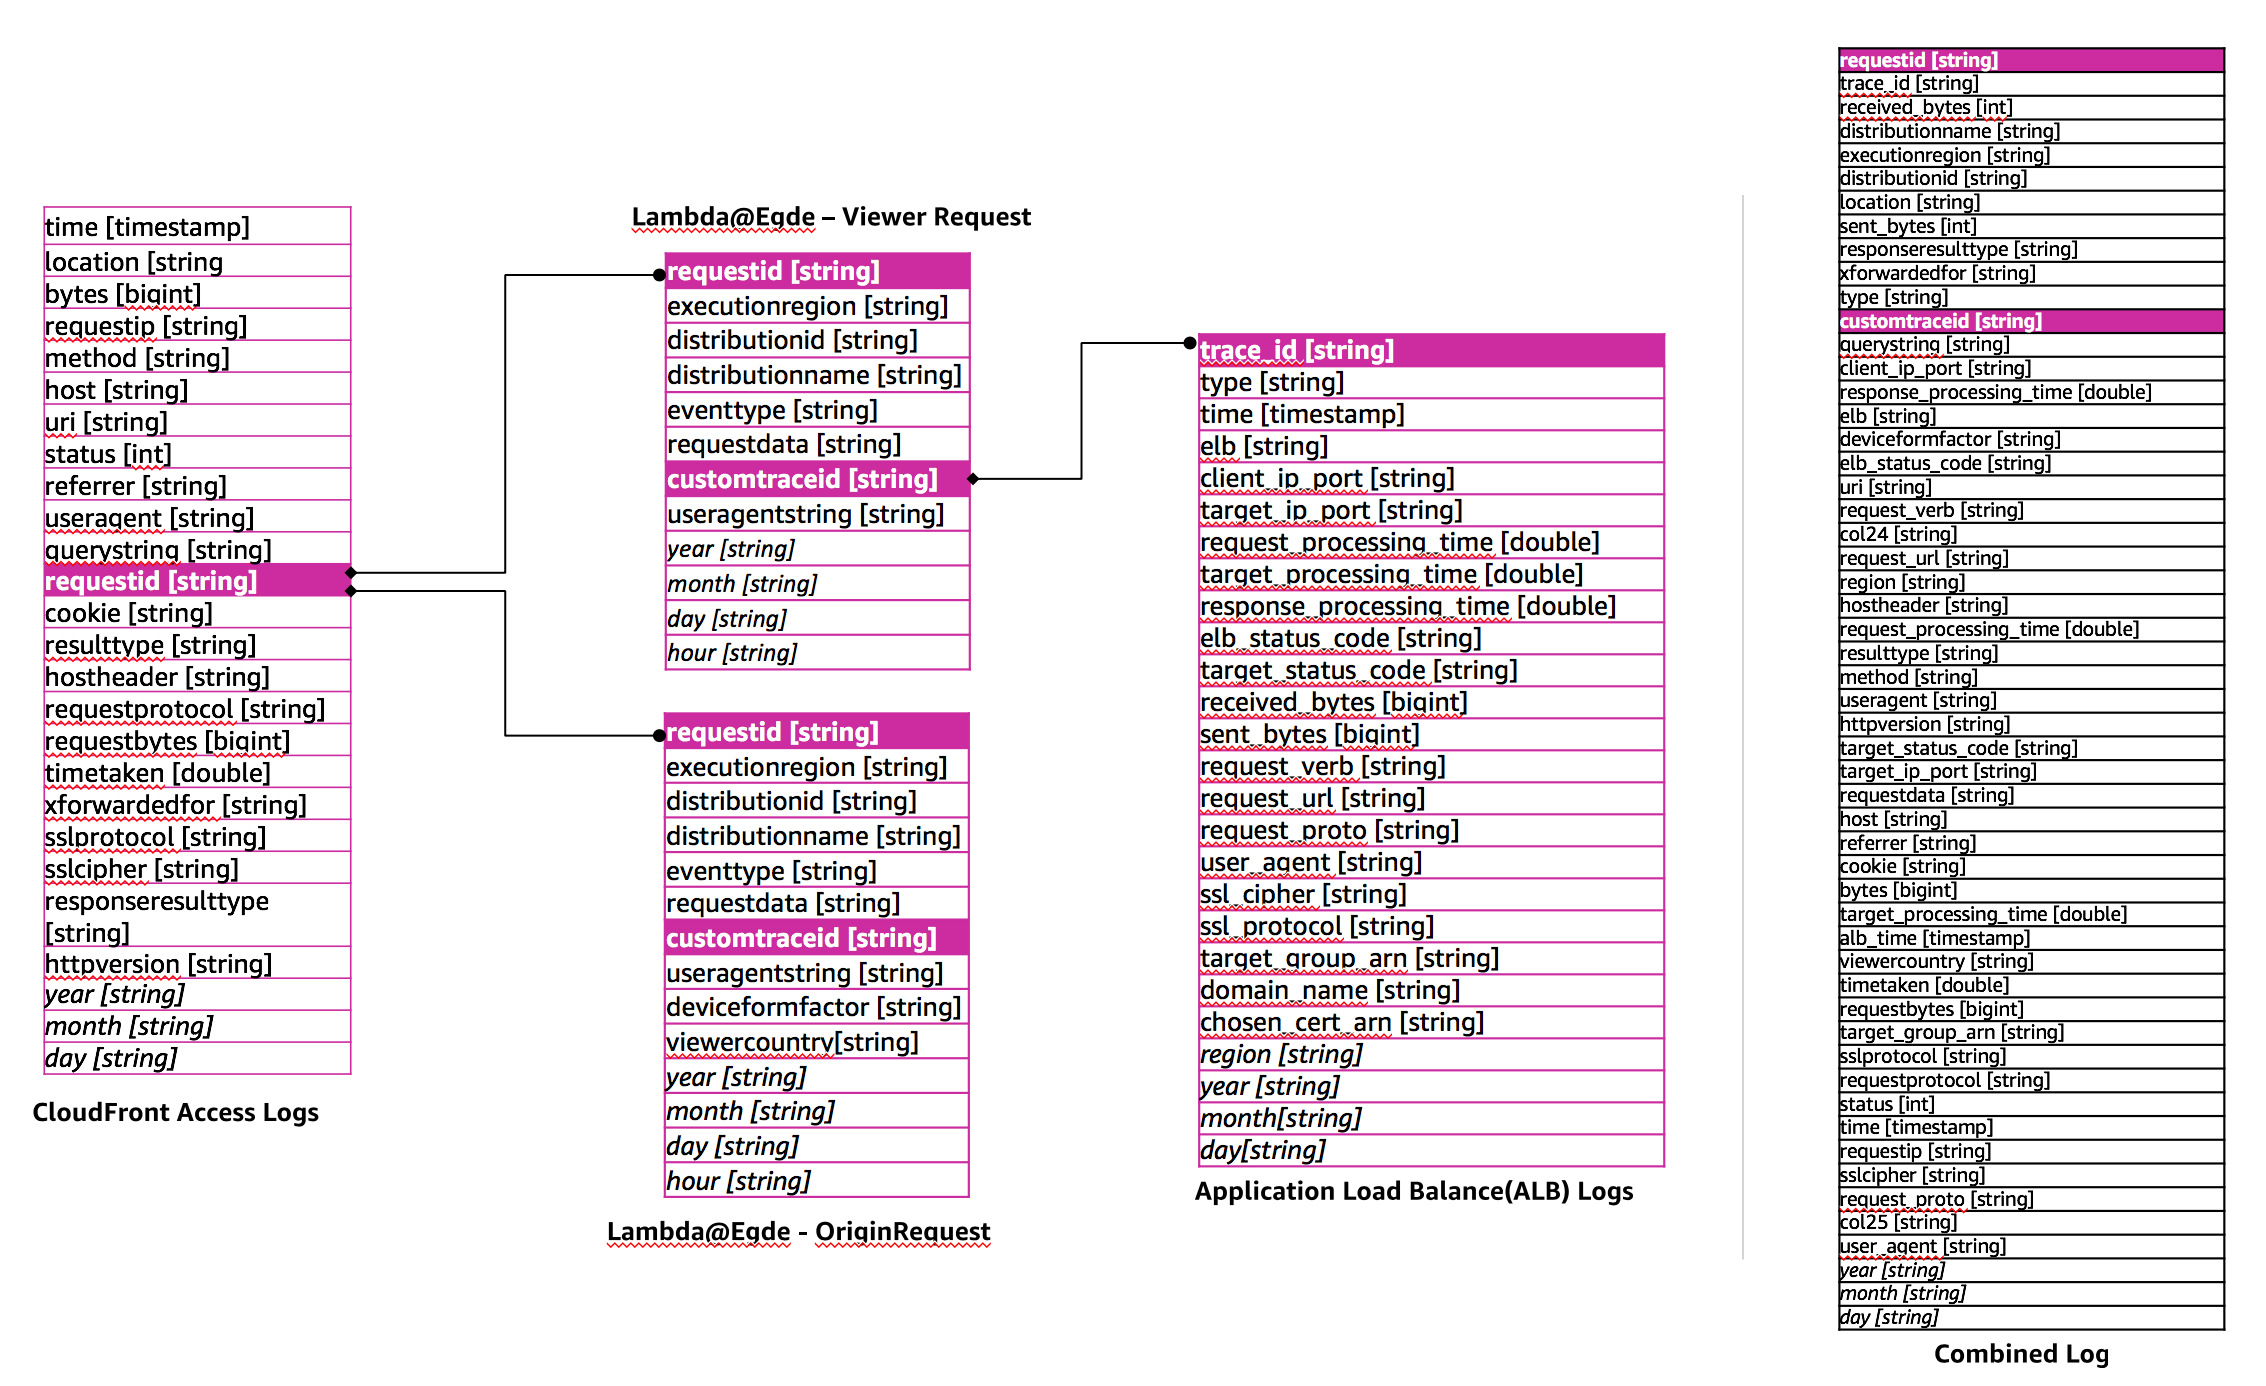
As part of the log data generation generation, the following four different logs have been collected
|Log Name|Raw Log Location|Format|Log Entries|
|---|----|---|-----|
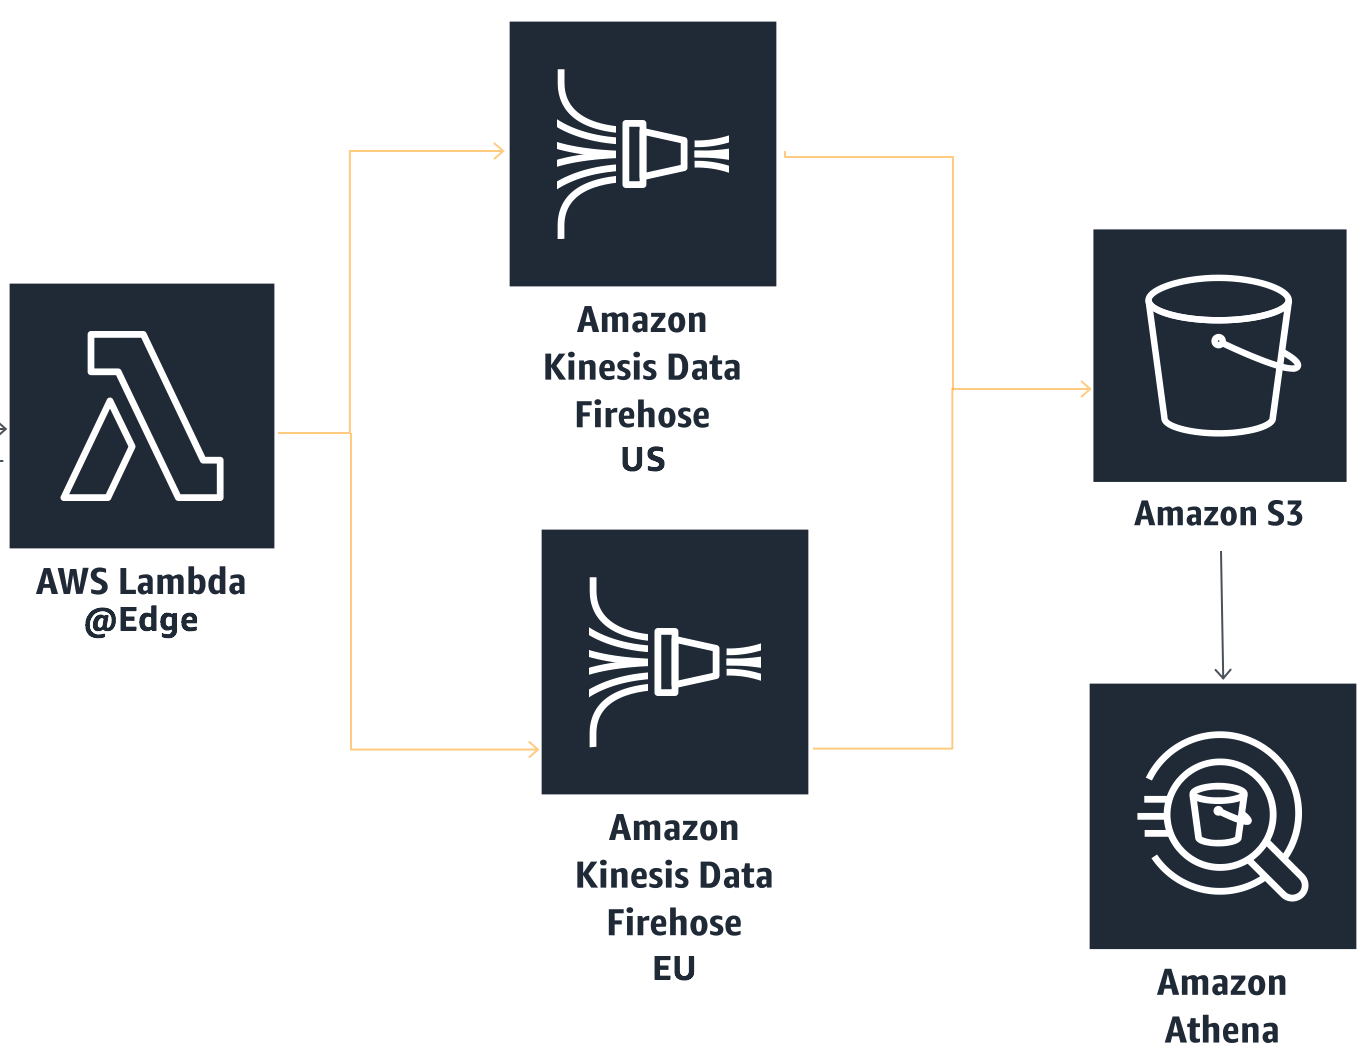
|Viewer request triggered Lambda@Edge logs|aws s3 ls s3://eu-west-1.data-analytics/raw/lelogs/viewer-request/|JSON|{executionregion, requestid, distributionid, distributionname, eventtype, requestdata, customtraceid, useragentstring}|
|Amazon CloudFront access logs|aws s3 ls s3://eu-west-1.data-analytics/raw/cf-accesslogs/|CSV|[Web Distribution Log File Format](https://docs.aws.amazon.com/AmazonCloudFront/latest/DeveloperGuide/AccessLogs.html#BasicDistributionFileFormat)|
|Origin request triggered Lambda@Edge logs|aws s3 ls s3://eu-west-1.data-analytics/raw/lelogs/origin-request/|JSON|{executionregion, requestid, distributionid, distributionname, eventtype, requestdata, customtraceid, viewercountry, deviceformfactor}|
|Application Load Balancer(ALB) logs|aws s3 ls s3://eu-west-1.data-analytics/raw/lblogs/|JSON|[Access Log Entries](https://docs.aws.amazon.com/elasticloadbalancing/latest/application/load-balancer-access-logs.html#access-log-entry-format)|
---
### Lab Overview
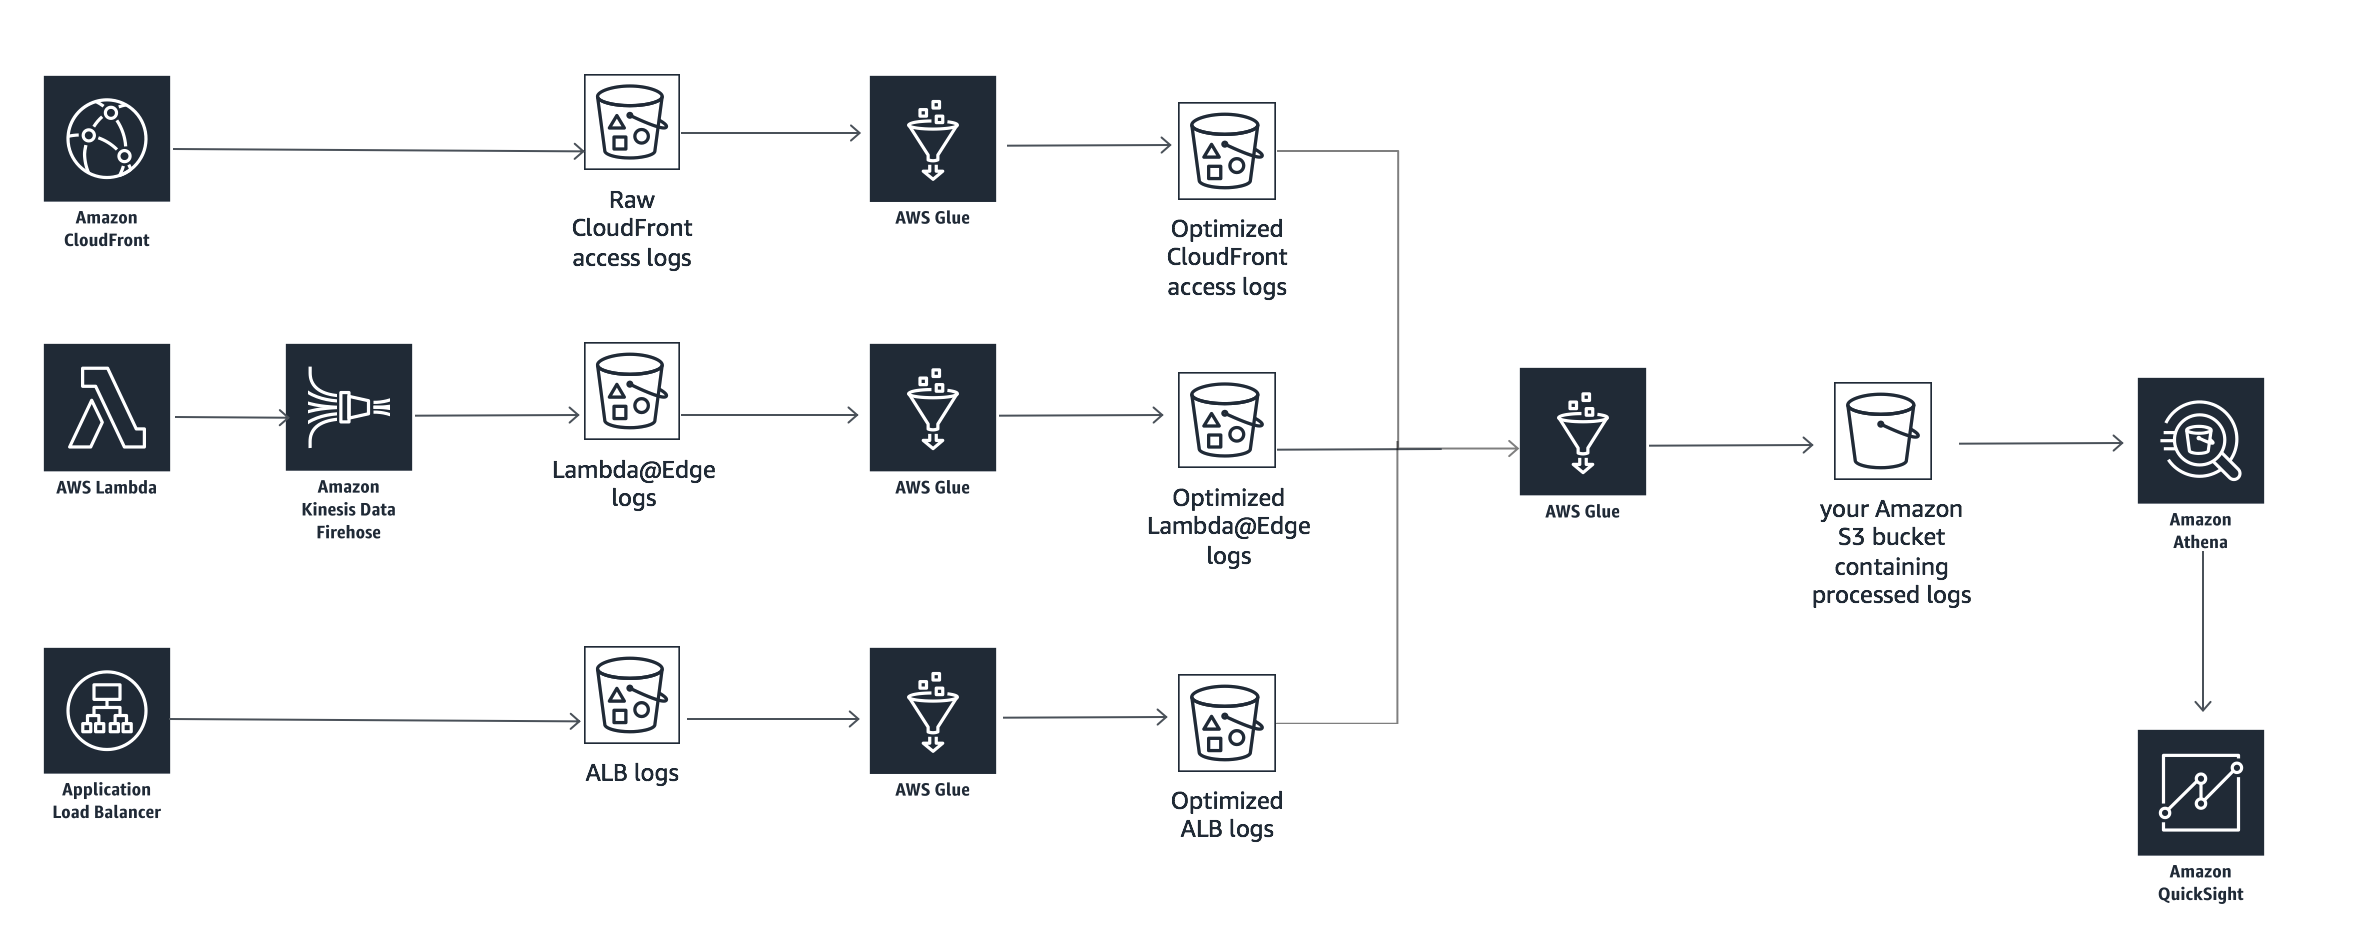
In this lab, you are going to build a serverless architecture to combine all the four logs - 1) Viewer request triggered Lambda@Edge logs, 2) Origin request triggered Lambda@Edge logs, 3) Amazon CloudFront access logs and 4) Application Load Balancer(ALB) logs using AWS Glue and then analyze the combined logs using Amazon Athena and visualize in Amazon QuickSight. The logs you are going to use is already converter from raw logs in CSV or JSON format to optimized logs into partition and compresses parquet format.
|Log Name|Partition|Conversion Script|Github|Optimized Log Location|
|---|----|---|---|---|
|Viewer request triggered Lambda@Edge logs|year, month, day, hour|[lelogconverter.py](./lelogconverter.py)|-|aws s3 ls s3://eu-west-1.data-analytics/cflogworkshop/optimized/lelogs/viewer-request/|
|Amazon CloudFront access logs|year, month, day|[sample_cloudfront_job.py](https://github.com/awslabs/athena-glue-service-logs/blob/master/scripts/sample_cloudfront_job.py)|[Link](https://github.com/awslabs/athena-glue-service-logs)|aws s3 ls s3://us-east-1.data-analytics/cflogworkshop/optimized/cf-accesslogs/|
|Origin request triggered Lambda@Edge logs|year, month, day, hour|[lelogconverter.py](./lelogconverter.py)|-|aws s3 ls s3://eu-west-1.data-analytics/cflogworkshop/optimized/lelogs/origin-request/|
|Application Load Balancer(ALB) logs|region, year, month, day|[sample_alb_job.py](https://github.com/awslabs/athena-glue-service-logs/blob/master/scripts/sample_alb_job.py)|[Link](https://github.com/awslabs/athena-glue-service-logs)|aws s3 ls s3://eu-west-1.data-analytics/cflogworkshop/optimized/lblogs/|
---
### Lambda @ Edge
|EventType|Script|
|---|----|
|Viewer Request|[index.js](./viewerRequest-Lambda/index.js)|
|Origin Request|[index.js](./originRequest-Lambda/index.js)|
---
---
## Pre-requisites
This module requires:
- You should have active AWS account with Administrator IAM role.
---
---
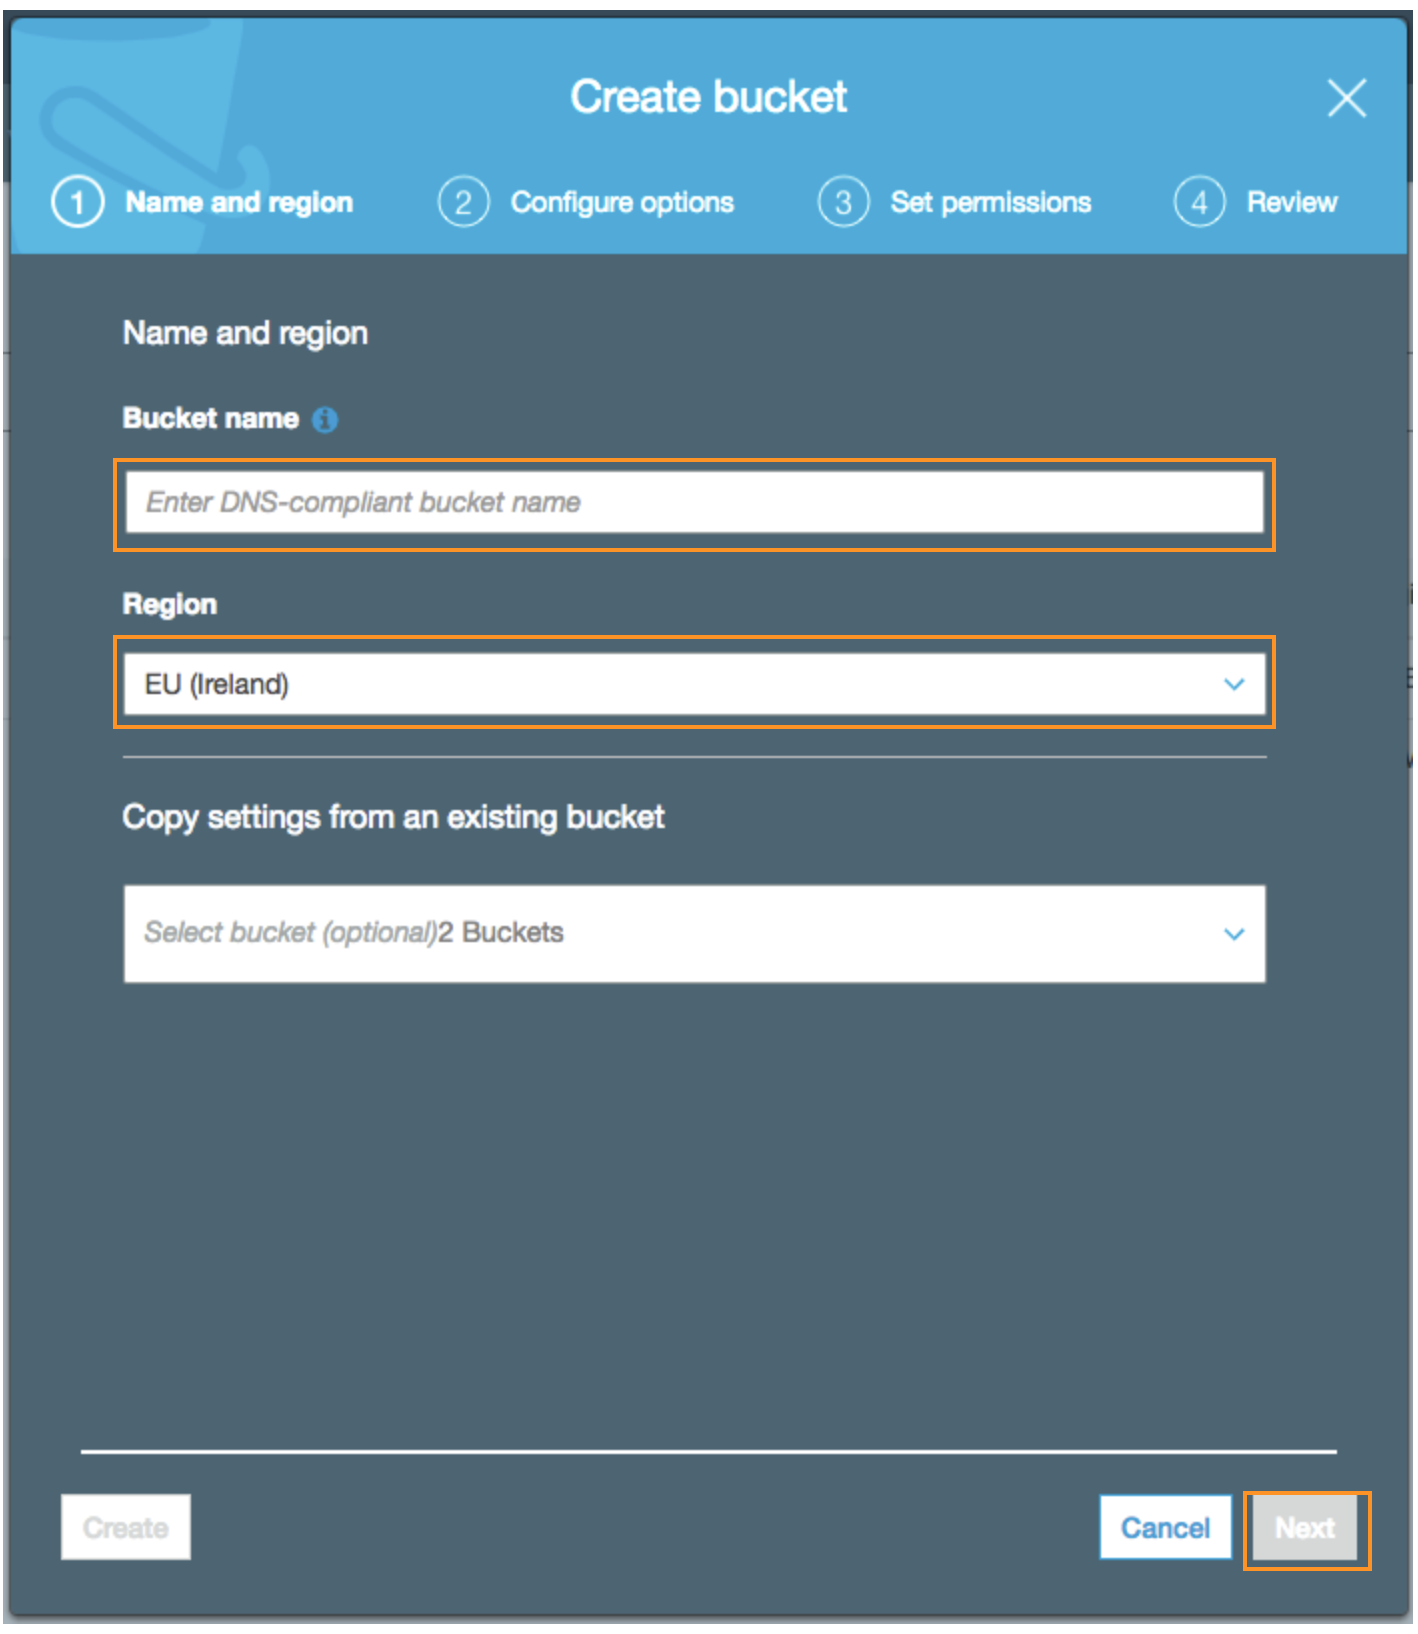
## Create Amazon S3 Bucket
In this section you will be creating an Amazon S3 bucket to store the combined (by joining Viewer request triggered Lambda@Edge logs, Origin request triggered Lambda@Edge logs, Amazon CloudFront access logs and Application Load Balancer(ALB) logs) and optimized logs written by the AWS Glue ETL job that you create and execute as part of this workshop.
- Open the AWS Management console for Amazon S3 from [here](https://s3.console.aws.amazon.com/s3/home?region=eu-west-1)
- On the S3 Dashboard, Click on **Create Bucket.**
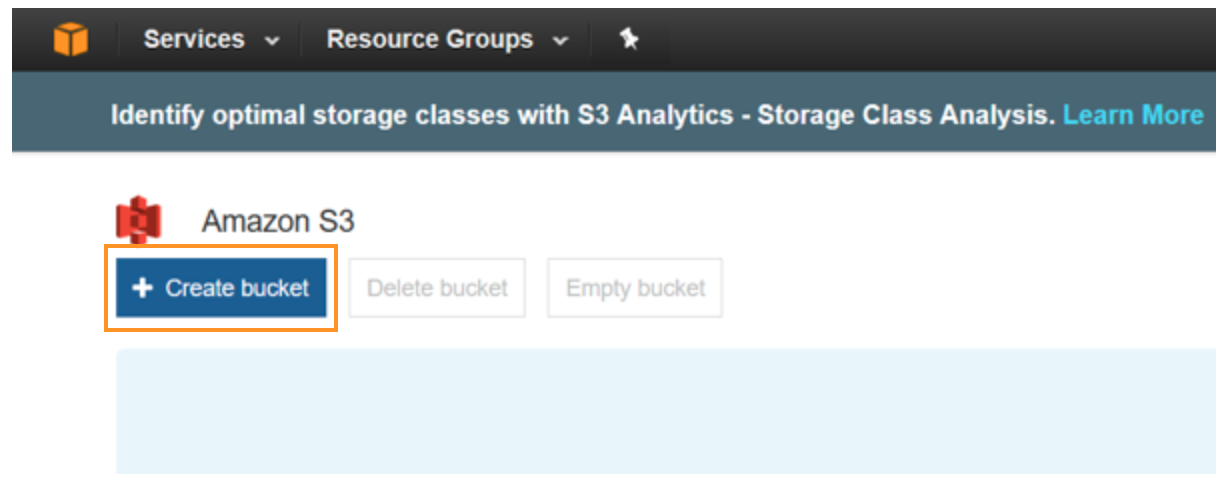
- In the **Create Bucket** pop-up page, input a unique **Bucket name**. Choose a large bucket name with many random characters and numbers (no spaces). You will need this Bucket name later in this exercise.
- Select the region as **EU (Ireland)**
- Click **Next** to navigate to next tab
- In the **Configure Options** tab, leave all options as default
- Click **Next** to navigate to next tab
- In the **Set permissions** tag, leave all options as default
- Click **Next** to navigate to next tab
- In the **Review** tab, click on **Create Bucket**
---
---
## Creating Glue Data Catalog Database and Table using Amazon Athena
In this section you will be creating an AWS Data Catalog Database along with the tables pointing to the optimized logs. These logs have been pre-generated as part of the workshop. You will be creating the following tables, loading the partitions into each of these tables, and previewing the fields.
|Table Name|Log Name|Partition|
|---|---|----|
|lambdaedge_logs_viewer_request_optimized|Viewer request triggered Lambda@Edge logs|year, month, day, hour|
|cf_access_optimized|Amazon CloudFront access logs|year, month, day|
|lambdaedge_logs_origin_request_optimized|Origin request triggered Lambda@Edge logs|year, month, day, hour|
|alb_access_optimized|Application Load Balancer(ALB) logs|region, year, month, day|
The AWS Glue ETL job that will combine all the four logs will refer to metadata in AWS Glue data catalog to read the logs from Amazon S3.
### Create Glue Data Catalog Database using Amazon Athena
- Open the AWS Management Console for Athena from [here](https://console.aws.amazon.com/athena/home).
- If this is your first time visiting the AWS Management Console for Athena, you will get a Getting Started page. Choose Get Started to open the Query Editor. If this isn't your first time, the Athena Query Editor opens.
- Make a note of the AWS region name, for example, for this lab you will need to choose the *EU (Ireland)* region.
- In the *Athena Query Editor*, you will see a query pane with an example query. Now you can start entering your query in the query pane.
- To create a database named reInvent2018_aws_service_logs, copy the following statement, and then choose Run Query:
```sql
CREATE DATABASE IF NOT EXISTS reInvent2018_aws_service_logs
```
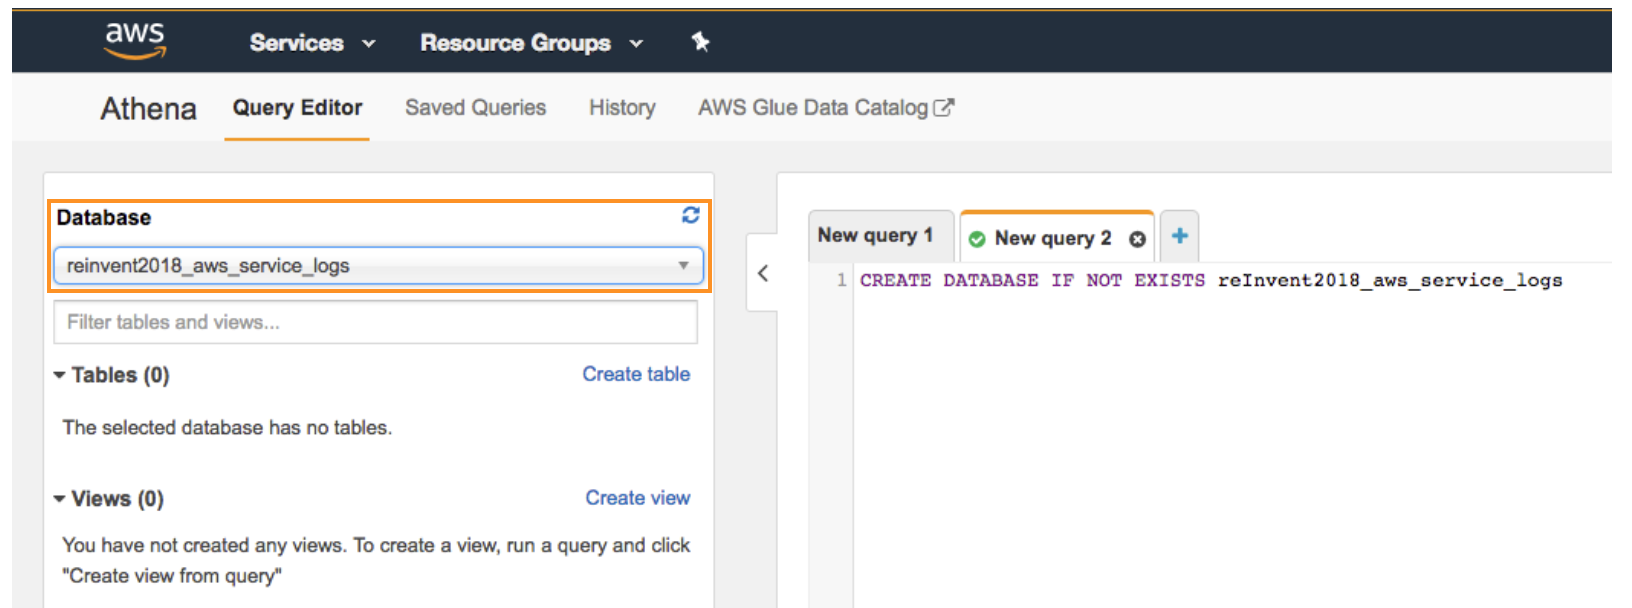
- Ensure *reInvent2018_aws_service_logs* appears in the DATABASE list on the Catalog dashboard
---
### Create Glue Data Catalog for CloudFront Access Logs in optimized Parquet Format
- Ensure that current AWS region is **EU (Ireland)** region
- Ensure *reInvent2018_aws_service_logs* is selected from the DATABASE list and then choose New Query.
- In the query pane, copy the following statement to create a the *cf_access_optimized* table, and then choose **Run Query**:
```sql
CREATE EXTERNAL TABLE IF NOT EXISTS reInvent2018_aws_service_logs.cf_access_optimized(
time timestamp,
location string,
bytes bigint,
requestip string,
method string,
host string,
uri string,
status int,
referrer string,
useragent string,
querystring string,
cookie string,
resulttype string,
requestid string,
hostheader string,
requestprotocol string,
requestbytes bigint,
timetaken double,
xforwardedfor string,
sslprotocol string,
sslcipher string,
responseresulttype string,
httpversion string)
PARTITIONED BY (
year string,
month string,
day string)
ROW FORMAT SERDE 'org.apache.hadoop.hive.ql.io.parquet.serde.ParquetHiveSerDe'
STORED AS PARQUET
LOCATION 's3://us-east-1.data-analytics/cflogworkshop/optimized/cf-accesslogs'
TBLPROPERTIES("parquet.compress"="SNAPPY")
```
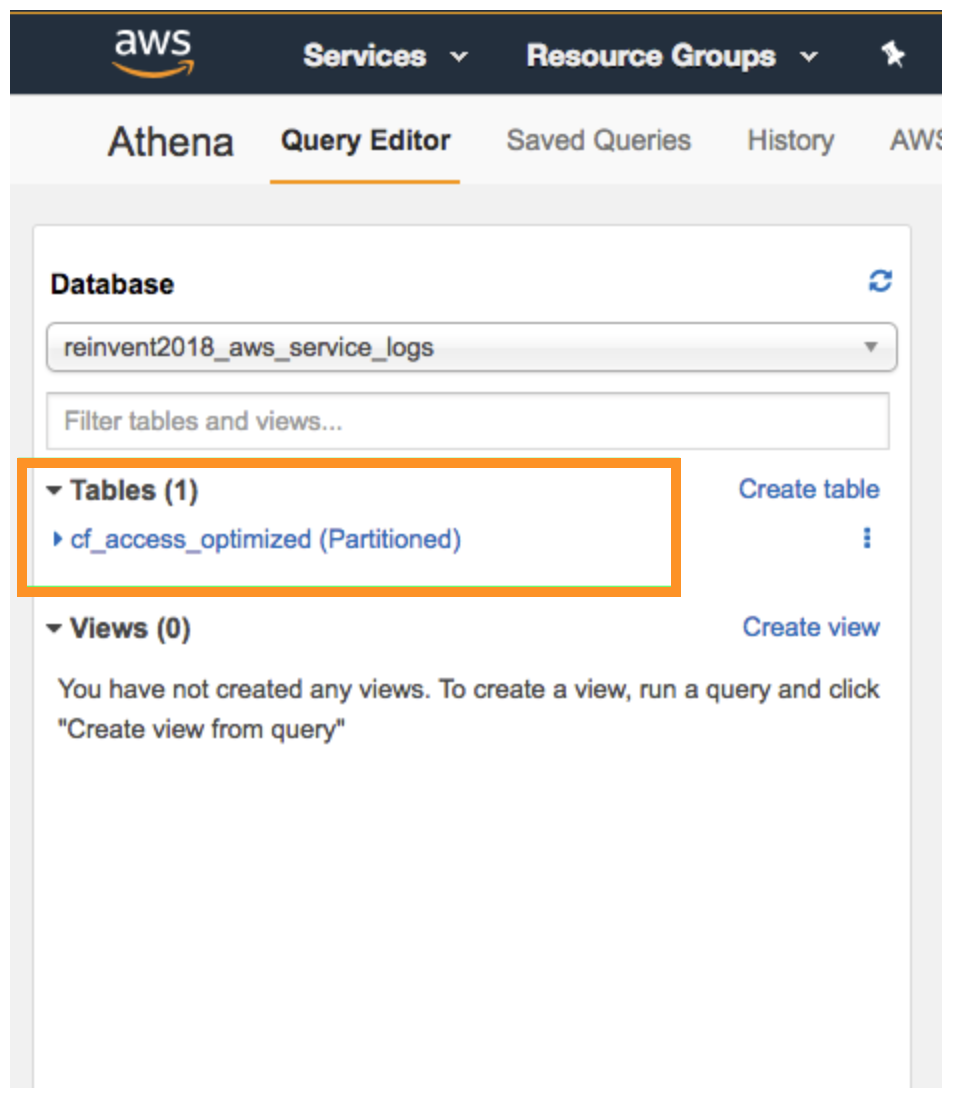
Now that you have created the table you need to add the partition metadata to the AWS Glue Data Catalog.
Choose **New Query**, copy the following statement into the query pane, and then choose **Run Query** to add partition metadata
```sql
MSCK REPAIR TABLE reInvent2018_aws_service_logs.cf_access_optimized
```
- Get the total number of CloudFront Access Log records:
```sql
SELECT count(*) AS rowcount FROM reInvent2018_aws_service_logs.cf_access_optimized
```
> :warning: Ensure that the rowcount = **207535**
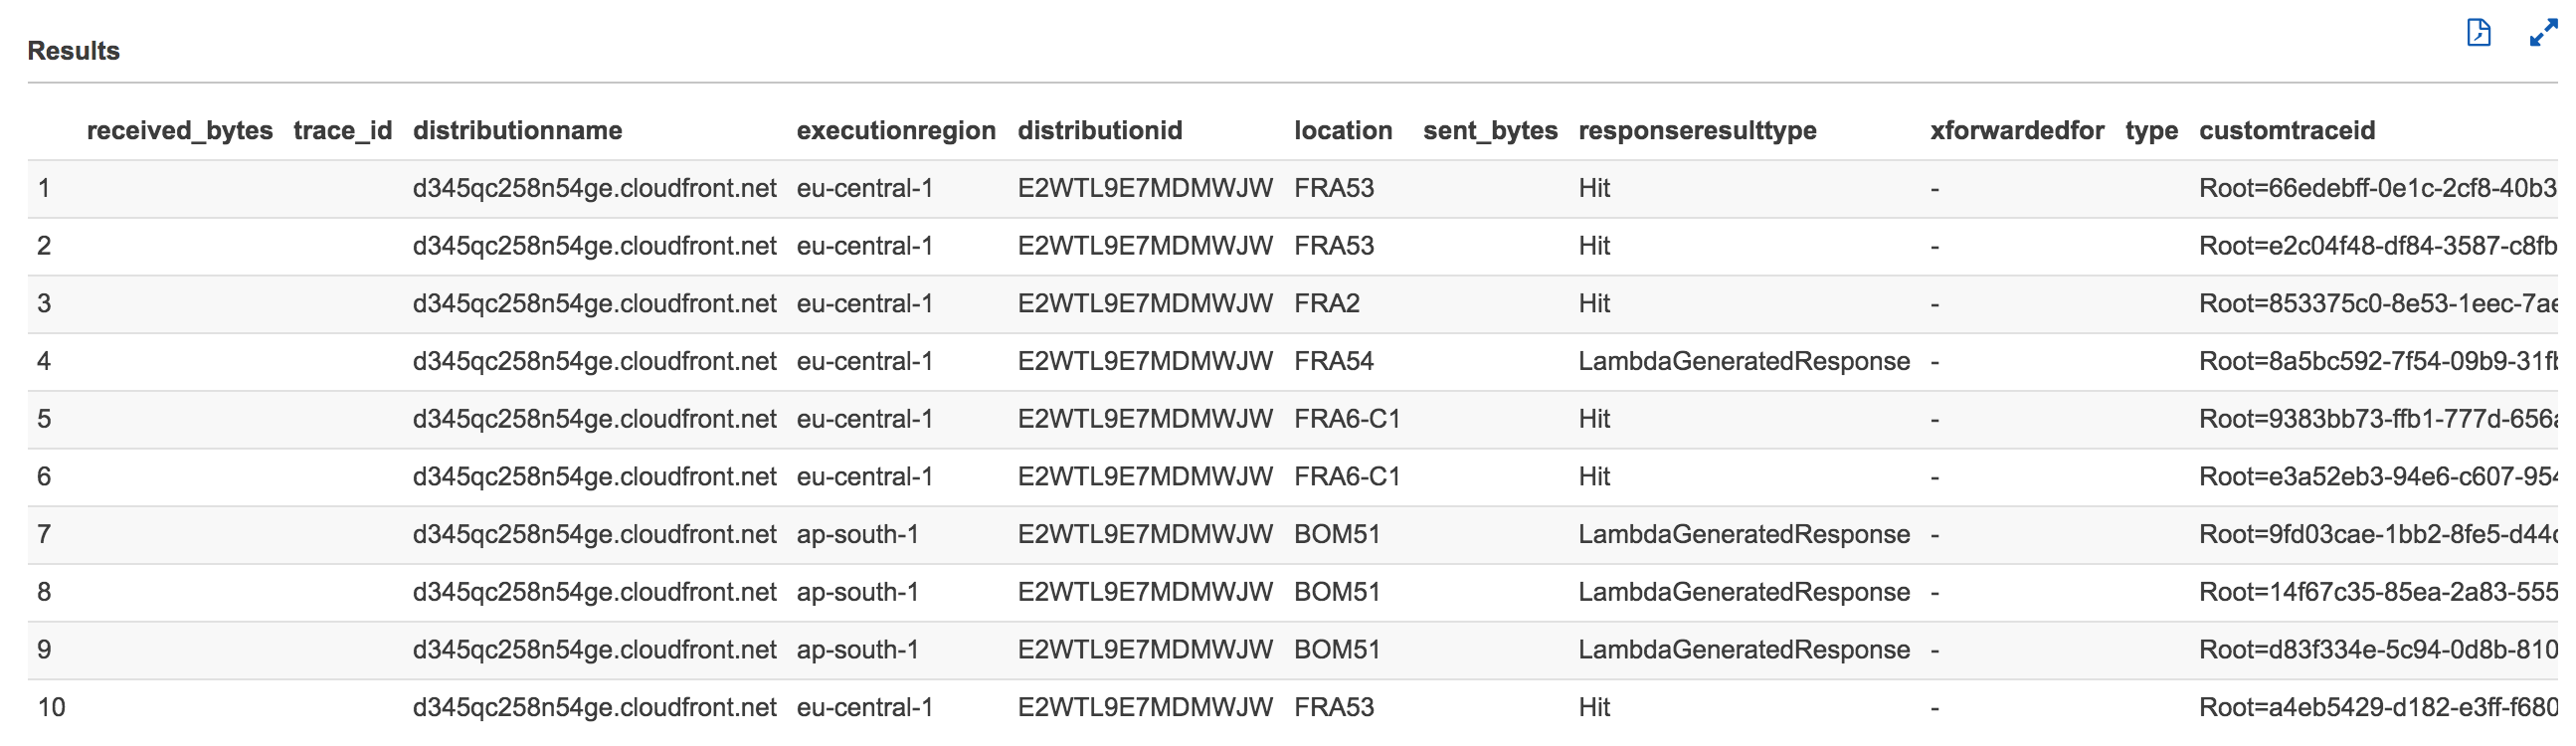
- Get the first ten records:
```sql
SELECT * FROM reInvent2018_aws_service_logs.cf_access_optimized LIMIT 10
```
*After a few seconds, Athena will display your query results as shown below:*
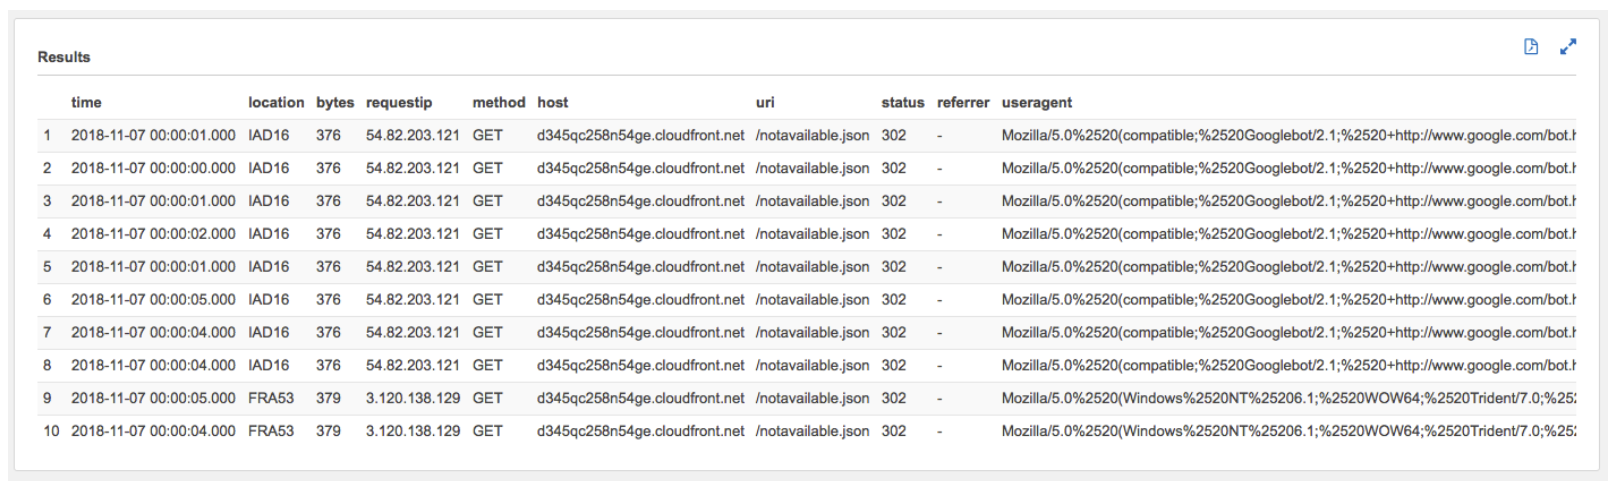
Click to expand to review the values in the following fields/columns as you will be using them in this workshop
|Field Name|Description|type
|---|----|---|
|requestid|An encrypted string that uniquely identifies a request. This field value is used to join the optimized CloudFront access logs with the optimized Lambda@Edge logs|string|
|time|The time when the CloudFront server finished responding to the request (in UTC), for example, 01:42:39|timestamp|
|location|The edge location that served the request. Each edge location is identified by a three-letter code and an arbitrarily assigned number, for example, DFW3. The three-letter code typically corresponds with the International Air Transport Association airport code for an airport near the edge location. (These abbreviations might change in the future.) For a list of edge locations, see the Amazon CloudFront detail page, [http://aws.amazon.com/cloudfront](http://aws.amazon.com/cloudfront)|string|
|uri|The query string portion of the URI, if any. When a URI doesn't contain a query string, the value of cs-uri-query is a hyphen (-). For more information, see [Caching Content Based on Query String Parameters](https://docs.aws.amazon.com/AmazonCloudFront/latest/DeveloperGuide/QueryStringParameters.html).|string|
|status| One of the following values: - An HTTP status code (for example, 200). For a list of HTTP status codes, see [RFC 2616](http://www.w3.org/Protocols/rfc2616/rfc2616-sec10.html), [Hypertext Transfer Protocol—HTTP 1.1, section 10, Status Code Definitions]((http://www.w3.org/Protocols/rfc2616/rfc2616-sec10.html)). For more information, see [How CloudFront Processes and Caches HTTP 4xx and 5xx Status Codes from Your Origin](https://docs.aws.amazon.com/AmazonCloudFront/latest/DeveloperGuide/HTTPStatusCodes.html).
- 000, which indicates that the viewer closed the connection (for example, closed the browser tab) before CloudFront could respond to a request. If the viewer closes the connection after CloudFront starts to send the object, the log contains the applicable HTTP status code.
|string|
|useragent| The value of the User-Agent header in the request. The User-Agent header identifies the source of the request, such as the type of device and browser that submitted the request and, if the request came from a search engine, which search engine. For more information, see [User-Agent Header](https://docs.aws.amazon.com/AmazonCloudFront/latest/DeveloperGuide/RequestAndResponseBehaviorCustomOrigin.html#request-custom-user-agent-header).
|responseresulttype|How CloudFront classified the response just before returning the response to the viewer. Possible values include:- Hit – CloudFront served the object to the viewer from the edge cache.For information about a situation in which CloudFront classifies the result type as Hit even though the response from the origin contains a Cache-Control: no-cache header, see [Simultaneous Requests for the Same Object (Traffic Spikes)](https://docs.aws.amazon.com/AmazonCloudFront/latest/DeveloperGuide/RequestAndResponseBehaviorCustomOrigin.html#request-custom-traffic-spikes).
- RefreshHit – CloudFront found the object in the edge cache but it had expired, so CloudFront contacted the origin to determine whether the cache has the latest version of the object and, if not, to get the latest version.
- Miss – The request could not be satisfied by an object in the edge cache, so CloudFront forwarded the request to the origin server and returned the result to the viewer.
- LimitExceeded – The request was denied because a CloudFront limit was exceeded.
CapacityExceeded – CloudFront returned an HTTP 503 status code (Service Unavailable) because the CloudFront edge server was temporarily unable to respond to requests.- Error – Typically, this means the request resulted in a client error (sc-status is 4xx) or a server error (sc-status is 5xx).
- Redirect – CloudFront redirects from HTTP to HTTPS.If sc-status is 403 and you configured CloudFront to restrict the geographic distribution of your content, the request might have come from a restricted location. For more information about geo restriction, see [Restricting the Geographic Distribution of Your Content](https://docs.aws.amazon.com/AmazonCloudFront/latest/DeveloperGuide/georestrictions.html).If the value of x-edge-result-type is Error and the value of x-edge-response-result-type is not Error, the client disconnected before finishing the download.
|string|
|timetaken|The number of seconds (to the thousandth of a second, for example, 0.002) between the time that a CloudFront edge server receives a viewer's request and the time that CloudFront writes the last byte of the response to the edge server's output queue as measured on the server. From the perspective of the viewer, the total time to get the full object will be longer than this value due to network latency and TCP buffering.|double|
|year(partition)|The year on which the event occurred.|string|
|month(partition)|The month on which the event occurred.|string|
|day(partition)|The day on which the event occurred.|string|
---
### Create Glue Data Catalog for Application Load Balancer(ALB) Access Logs in optimized Parquet Format
In the query pane, copy the following statement to create a the **alb_access_optimized** table, and then choose **Run Query**:
```sql
CREATE EXTERNAL TABLE IF NOT EXISTS reInvent2018_aws_service_logs.alb_access_optimized(
type string,
time timestamp,
elb string,
client_ip_port string,
target_ip_port string,
request_processing_time double,
target_processing_time double,
response_processing_time double,
elb_status_code string,
target_status_code string,
received_bytes bigint,
sent_bytes bigint,
request_verb string,
request_url string,
request_proto string,
user_agent string,
ssl_cipher string,
ssl_protocol string,
target_group_arn string,
trace_id string,
domain_name string,
chosen_cert_arn string)
PARTITIONED BY (
region string,
year string,
month string,
day string)
ROW FORMAT SERDE 'org.apache.hadoop.hive.ql.io.parquet.serde.ParquetHiveSerDe'
STORED AS PARQUET
LOCATION 's3://eu-west-1.data-analytics/cflogworkshop/optimized/lblogs'
TBLPROPERTIES("parquet.compress"="SNAPPY")
```
Now that you have created the table you need to add the partition metadata to the AWS Glue Catalog.
- Choose **New Query**, copy the following statement into the query pane, and then choose **Run Query** to add partition metadata.
```sql
MSCK REPAIR TABLE reInvent2018_aws_service_logs.alb_access_optimized
```
- Get the total number of ALB Access Log records:
```sql
SELECT count(*) AS rowcount FROM reInvent2018_aws_service_logs.alb_access_optimized
```
> :warning: Ensure that the rowcount = **15355**
- Get the first ten records:
```sql
SELECT * FROM reInvent2018_aws_service_logs.alb_access_optimized LIMIT 10
```
After a few seconds, Athena will display your query results as shown below:
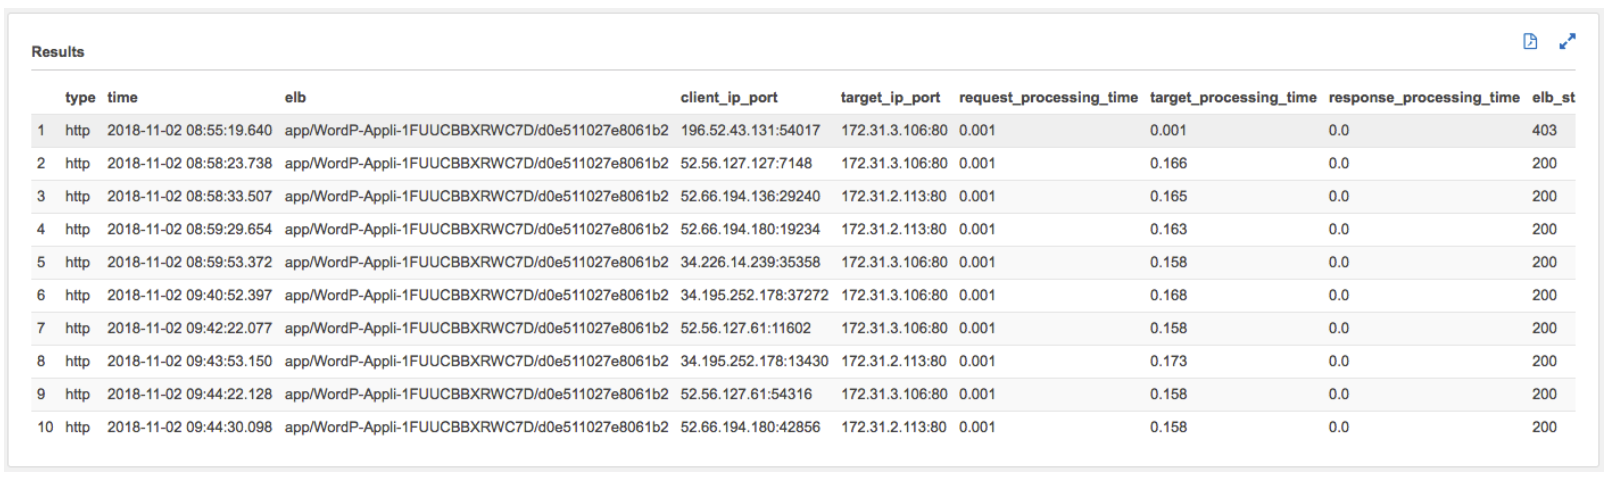
Click to expand to review the values in the following fields/columns as you will be using them in this workshop
|Field Name|Description|type
|---|----|---|
|trace_id|The contents of the X-Amzn-Trace-Id header, enclosed in double quotes. This field is used to join the optimized ALB logs with the optimized Lambda@Edge logs which in turn is used to correlate with the optimized CloudFront access logs using the requestId filed. For more information see [Request Tracing for Your Application Load Balancer](https://docs.aws.amazon.com/elasticloadbalancing/latest/application/load-balancer-request-tracing.html). Example value: ```X-Amzn-Trace-Id: Self=1-67891234-12456789abcdef012345678;Root=1-67891233-abcdef012345678912345678```|string|
|request_processing_time|The total time elapsed (in seconds, with millisecond precision) from the time the load balancer received the request until the time it sent it to a target. This value is set to -1 if the load balancer can't dispatch the request to a target. This can happen if the target closes the connection before the idle timeout or if the client sends a malformed request. This value can also be set to -1 if the registered target does not respond before the idle timeout.| double|
|target_processing_time|The total time elapsed (in seconds, with millisecond precision) from the time the load balancer sent the request to a target until the target started to send the response headers. This value is set to -1 if the load balancer can't dispatch the request to a target. This can happen if the target closes the connection before the idle timeout or if the client sends a malformed request. This value can also be set to -1 if the registered target does not respond before the idle timeout. |double|
|response_processing_time|The total time elapsed (in seconds, with millisecond precision) from the time the load balancer received the response header from the target until it started to send the response to the client. This includes both the queuing time at the load balancer and the connection acquisition time from the load balancer to the client. This value is set to -1 if the load balancer can't send the request to a target. This can happen if the target closes the connection before the idle timeout or if the client sends a malformed request. |double|
|region(partition|The region of the load balancer and S3 bucket.|string|
|year(partition)|The year the log was delivered.|string|
|month(partition)|The month the log was delivered.|string|
|day(partition)|The day the logs was delivered.|string|
---
### Create Glue Data Catalog for Lambda@Edge Logs - Viewer Request in optimized Parquet Format
In the query pane, copy the following statement to create a the *lambdaedge_logs_viewer_request_optimized* table, and then choose **Run Query**:
```sql
CREATE EXTERNAL TABLE IF NOT EXISTS reInvent2018_aws_service_logs.lambdaedge_logs_viewer_request_optimized(
executionregion string,
requestid string,
distributionid string,
distributionname string,
eventtype string,
requestdata string,
customtraceid string,
useragentstring string)
PARTITIONED BY (
year string,
month string,
date string,
hour string)
ROW FORMAT SERDE 'org.apache.hadoop.hive.ql.io.parquet.serde.ParquetHiveSerDe'
STORED AS PARQUET
LOCATION 's3://eu-west-1.data-analytics/cflogworkshop/optimized/lelogs/viewer-request'
TBLPROPERTIES("parquet.compress"="SNAPPY")
```
Now that you have created the table you need to add the partition metadata to the AWS Glue Catalog.
- Choose **New Query**, copy the following statement into the query pane, and then choose **Run Query** to add partition metadata.
```sql
MSCK REPAIR TABLE reInvent2018_aws_service_logs.lambdaedge_logs_viewer_request_optimized
```
- Get the total number of Lambda@Edge Log - Viewer Request records:
```sql
SELECT count(*) AS rowcount FROM reInvent2018_aws_service_logs.lambdaedge_logs_viewer_request_optimized
```
> :warning: Ensure that the rowcount = **207837**
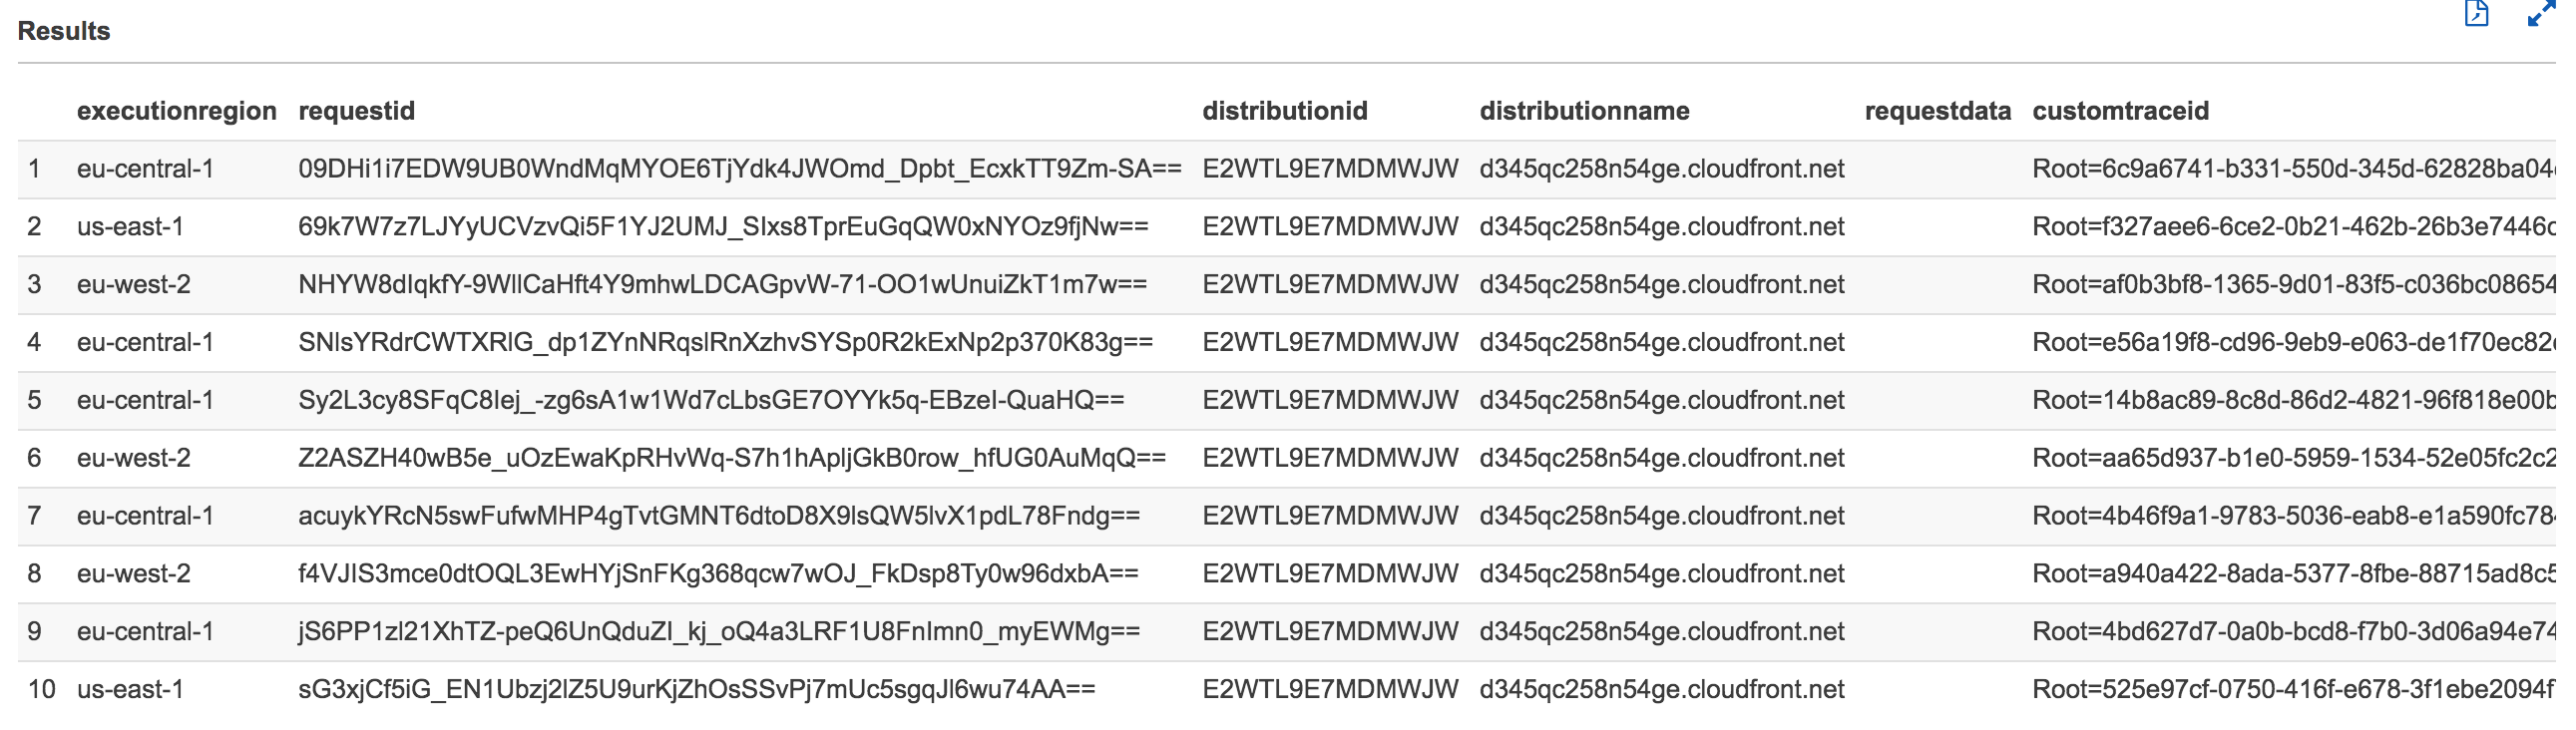
- Get the first ten records:
```sql
SELECT * FROM reInvent2018_aws_service_logs.lambdaedge_logs_viewer_request_optimized LIMIT 10
```
After a few seconds, Athena will display your query results as shown below:
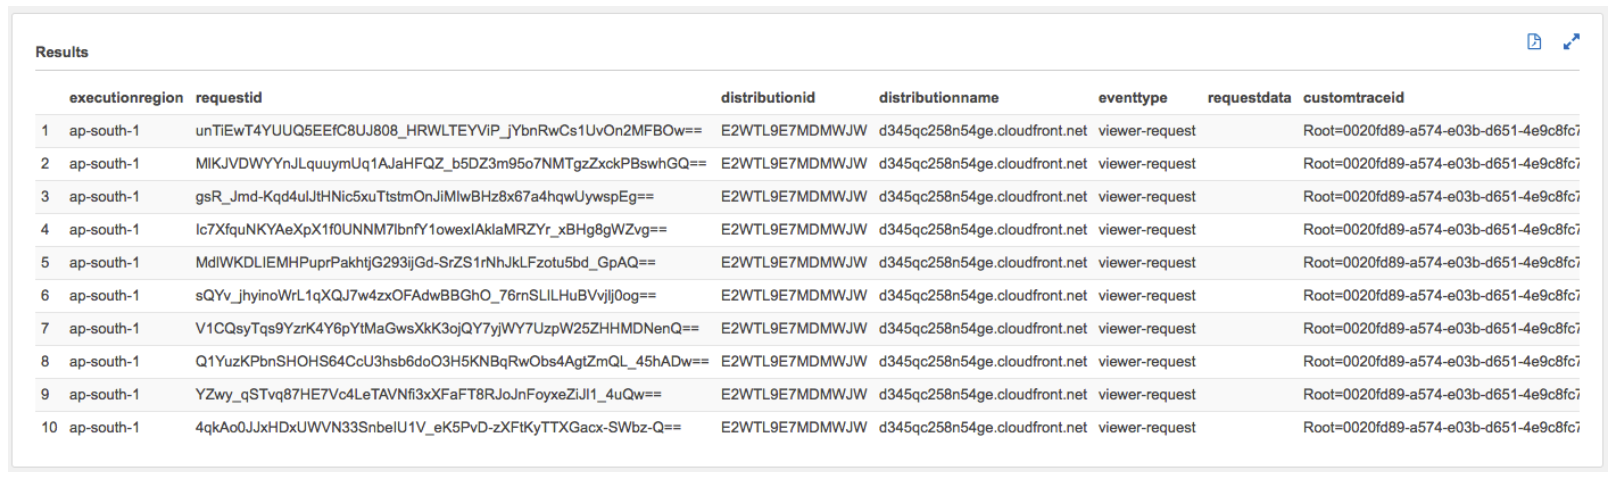
Click to expand to review the values in the following fields/columns
|Field Name|Description|type
|---|----|---|
|requestid|An encrypted string that uniquely identifies a request. This field value is used to join the optimized CloudFront access logs with the optimized Lambda@Edge logs. The requestId value also appears in CloudFront access logs as x-edge-request-id. For more information, see [Configuring and Using Access Logs](https://docs.aws.amazon.com/AmazonCloudFront/latest/DeveloperGuide/AccessLogs.html) and [Web Distribution Log File Format](https://docs.aws.amazon.com/AmazonCloudFront/latest/DeveloperGuide/AccessLogs.html#BasicDistributionFileFormat).|string|
|customtraceid|A uniquely generated value per request to join the ALB logs with Lambda@Edge logs. As part of client side instrumentation an unique value (Sample Value: ```Root=1-67891233-abcdef012345678912345678```) per request is generated and added two headers **x-my-trace-id** and **X-Amzn-Trace-Id**. The viewer-request triggered Lambda@Edge function extract the **x-my-trace-id** header and logs the value. For more details see [Viewer Request Trigger Lambda Function](./viewerRequest-Lambda/index.js). The **X-Amzn-Trace-Id** value is logged by the ALB. For more details refer, [Request Tracing for Your Application Load Balancer](https://docs.aws.amazon.com/elasticloadbalancing/latest/application/load-balancer-request-tracing.html). |string|
|executionregion|The AWS region where the Lambda@Edge function was executed.|string|
|eventtype|The type of trigger that's associated with the request. Value = "veiwer-request"|string|
|distributionid|The ID of the distribution that's associated with the request.|string|
|distributionname|The domain name of the distribution that's associated with the request.|string|
|year(partition)|The year on which the event occurred.|string|
|month(partition)|The month on which the event occurred.|string|
|day(partition)|The day on which the event occurred.|string|
|hour(partition)|The hour on which the event occurred.|string|
---
### Create Glue Data Catalog for Lambda@Edge Logs - Origin Request in optimized Parquet Format
In the query pane, copy the following statement to create a the *lambdaedge_logs_origin_request_optimized* table, and then choose **Run Query**:
```sql
CREATE EXTERNAL TABLE IF NOT EXISTS reInvent2018_aws_service_logs.lambdaedge_logs_origin_request_optimized(
executionregion string,
requestid string,
distributionid string,
distributionname string,
eventtype string,
requestdata string,
customtraceid string,
viewercountry string,
deviceformfactor string)
PARTITIONED BY (
year string,
month string,
date string,
hour string)
ROW FORMAT SERDE 'org.apache.hadoop.hive.ql.io.parquet.serde.ParquetHiveSerDe'
STORED AS PARQUET
LOCATION 's3://eu-west-1.data-analytics/cflogworkshop/optimized/lelogs/origin-request'
TBLPROPERTIES("parquet.compress"="SNAPPY")
```
Now that you have created the table you need to add the partition metadata to the AWS Glue Catalog.
- Choose **New Query**, copy the following statement into the query pane, and then choose **Run Query** to add partition metadata.
```sql
MSCK REPAIR TABLE reInvent2018_aws_service_logs.lambdaedge_logs_origin_request_optimized
```
- Get the total number of Lambda@Edge Log - Viewer Request records:
```sql
SELECT count(*) AS rowcount FROM reInvent2018_aws_service_logs.lambdaedge_logs_origin_request_optimized
```
> :warning: Ensure that the rowcount = **14517**
- Get the first ten records:
```sql
SELECT * FROM reInvent2018_aws_service_logs.lambdaedge_logs_origin_request_optimized LIMIT 10
```
After a few seconds, Athena will display your query results as shown below:
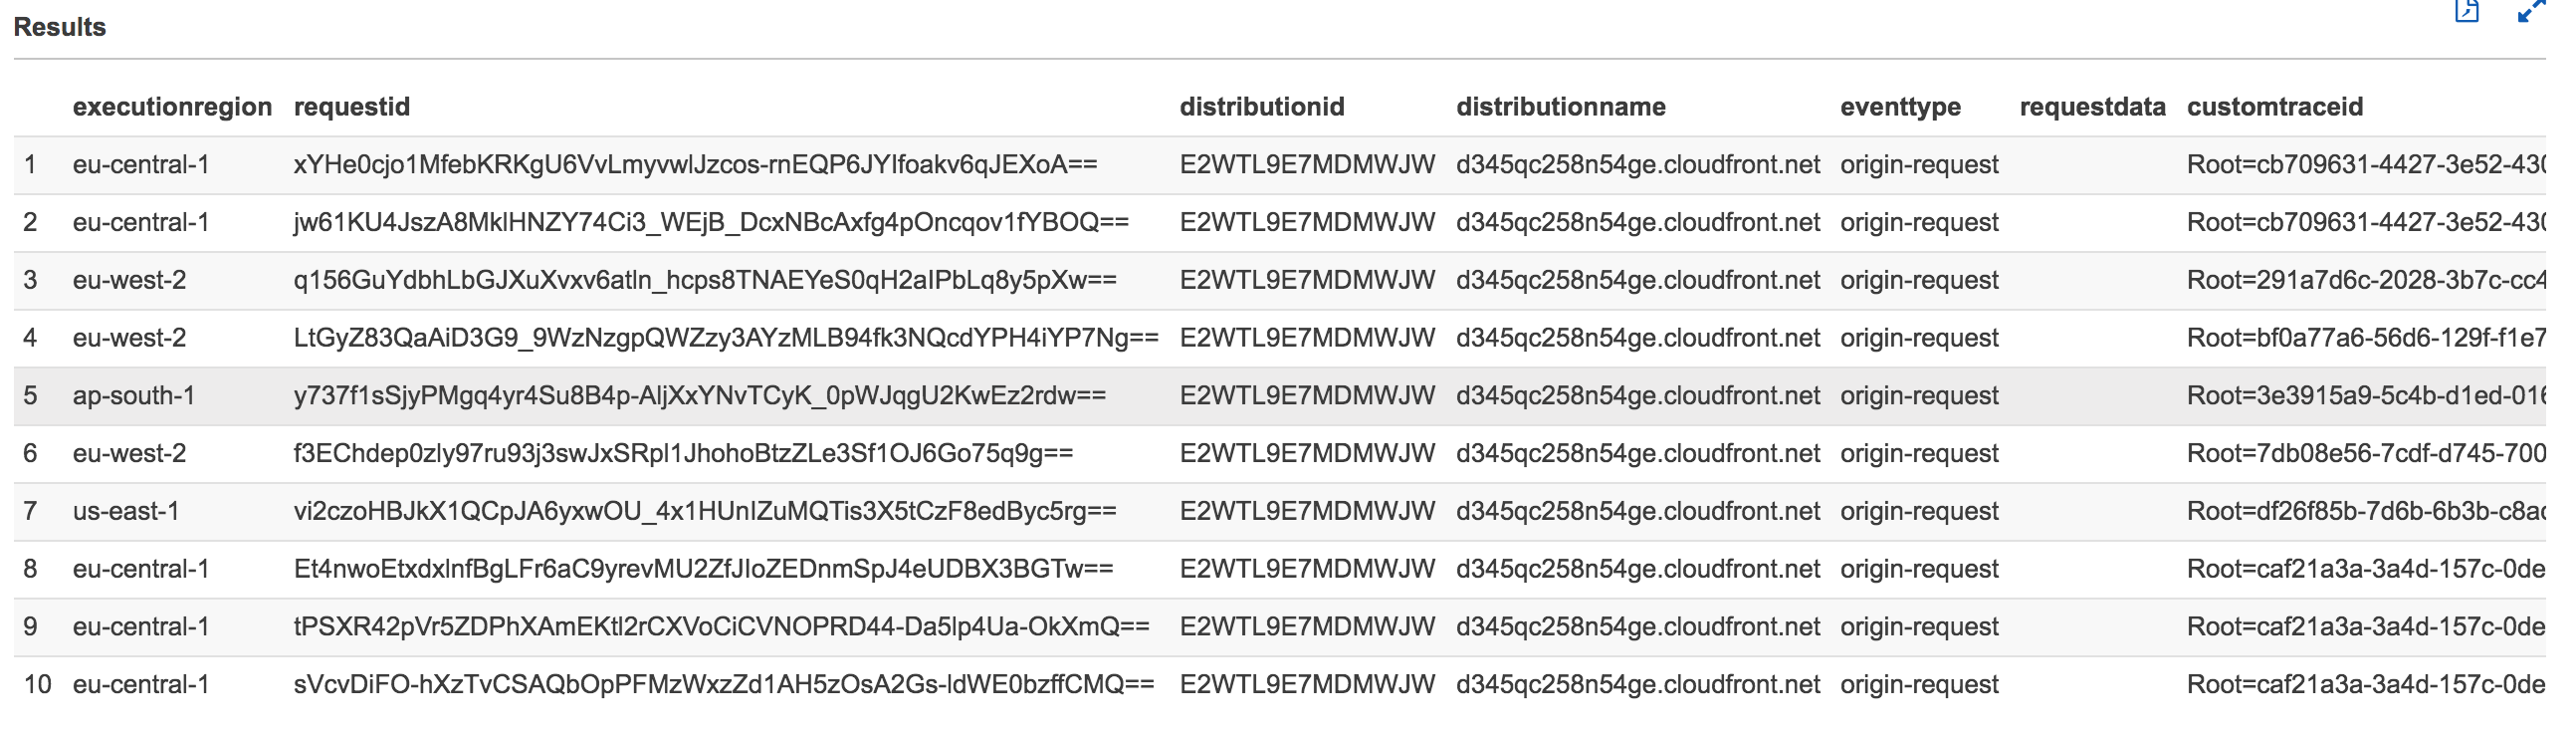
Click to expand to review the values in the following fields/columns
|Field Name|Description|type
|---|----|---|
|requestid|An encrypted string that uniquely identifies a request. This field value is used to join the optimized CloudFront access logs with the optimized Lambda@Edge logs. The requestId value also appears in CloudFront access logs as x-edge-request-id. For more information, see [Configuring and Using Access Logs](https://docs.aws.amazon.com/AmazonCloudFront/latest/DeveloperGuide/AccessLogs.html) and [Web Distribution Log File Format](https://docs.aws.amazon.com/AmazonCloudFront/latest/DeveloperGuide/AccessLogs.html#BasicDistributionFileFormat).|string|
|customtraceid|A uniquely generated value per request to join the ALB logs with Lambda@Edge logs. As part of client side instrumentation an unique value (Sample Value: ```Root=1-67891233-abcdef012345678912345678```) per request is generated and added two headers **x-my-trace-id** and **X-Amzn-Trace-Id**. The origin-request triggered Lambda@Edge function extract the **x-my-trace-id** header and logs the value. For more details see [Origin Request Trigger Lambda Function](./originRequest-Lambda/index.js). The **X-Amzn-Trace-Id** value is logged by the ALB. For more details refer, [Request Tracing for Your Application Load Balancer](https://docs.aws.amazon.com/elasticloadbalancing/latest/application/load-balancer-request-tracing.html). |string|
|executionregion|The AWS region where the Lambda@Edge function was executed.|string|
|eventtype|The type of trigger that's associated with the request. Value = "origin-request"|string|
|distributionid|The ID of the distribution that's associated with the request.|string|
|distributionname|The domain name of the distribution that's associated with the request.|string|
|viewercountry|Two letter country code based on IP address where the request came from. For more details [Configuring Caching Based on the Location of the Viewer](https://docs.aws.amazon.com/AmazonCloudFront/latest/DeveloperGuide/header-caching.html#header-caching-web-location). For an easy-to-use list of country codes, sortable by code and by country name, see the Wikipedia entry [ISO 3166-1 alpha-2](http://en.wikipedia.org/wiki/ISO_3166-1_alpha-2).|string|
|deviceformfactor|Category or form factor of the device based on the user agent associated with the request. For more details see [Configuring Caching Based on the Device Type](https://docs.aws.amazon.com/AmazonCloudFront/latest/DeveloperGuide/header-caching.html#header-caching-web-device). Possible values: - desktop
- mobile
- smarttv
- tablet
|string|
|year(partition)|The year on which the event occurred.|string|
|month(partition)|The month on which the event occurred.|string|
|day(partition)|The day on which the event occurred.|string|
|hour(partition)|The hour on which the event occurred.|string|
---
---
## Combine the logs using an AWS Glue ETL Job
Now that you have created all the AWS Glue data catalog tables for the optimized logs, in this section you will create an AWS Glue ETL job to join the four optimized logs - 1) Viewer request triggered Lambda@Edge logs, 2) Origin request triggered Lambda@Edge logs, 3)Amazon CloudFront access logs and 4) Application Load Balancer(ALB) logs. The output of the combined logs is written in optimized parquet format to the Amazon S3 bucket that you created at the beginning of this lab. The data is partition by year followed by month follow by day. You will also create an IAM role that grants AWS Glue service permission to read and write to Amazon S3 bucket and access the AWS Glue data catalog tables.
### Create AWS IAM Role
Create an IAM role that has permission to your Amazon S3 sources, targets, temporary directory, scripts, AWSGlueServiceRole and any libraries used by the job.
- Open the AWS Management console for AWS IAM from [here](https://console.aws.amazon.com/iam/home?region=us-west-2#/roles)
- On the IAM **Role** page click on **Create role**
- Choose **Glue** under **Choose the service that will use this role section**
- Ensure that **Glue** is shown under the **Select your use case** section
- Click on **Next:Permissions** on the bottom
- On the Attach permissions policies, search policies for S3 and check the box for **AmazonS3FullAccess**
> :warning: Do not click on the policy, you just have to check the corresponding checkbox
- On the same page, now search policies for Glue and check the box for **AWSGlueConsoleFullAccess** and **AWSGlueServiceRole**.
> :warning: Do not click on the policy, you just have to check the corresponding checkbox
- Click on **Next: Tags**
- Click on **Next: Review**
- Type the **Role name** *(e.g. ReInvent2018-CTD410-GlueRole)*
- Type the **Role description** (optional)
- Ensure that **AmazonS3FullAccess**, **AWSGlueConsoleFullAccess** and **AWSGlueServiceRole** are listed under policies
- Click **Create role**
---
### Create AWS Glue ETL Job
- Now that you have created the IAM role, open the AWS Management console for AWS Glue service from [here](https://eu-west-1.console.aws.amazon.com/glue/home?region=eu-west-1)
- If this is your first time visiting the AWS Management Console for AWS Glue, you will get a Getting Started page. Choose **Get Started**. If this isn't your first time, the **Tables** pages opens.
- Make a note of the AWS region name, for example, for this lab you will need to choose the **eu-west-1 (Ireland)** region
- Click on **Jobs** under the **ETL** section in the navigation pane on the left
- Click on **Add job** to create a new ETL job to join the Amazon CloudFront access logs, Lambda@Edge(viewer-request and origin-request) logs and Application Load Balancer logs
- On the **Job properties** page, type the **Name** *(e.g. ReInvent2018-CTD410-LogCombiner)* of the AWS Glue ETL job
- Choose the **IAM role** you created *(e.g. ReInvent2018-CTD410-GlueRole)* as part of the previous section in this lab from the drop down menu
- Select **A new script to be authored by you** for **This job runs**
- Select **Python** as the **ETL language**
- Click **Next**
- On the **Connections** page, click **Next**
- On the **Review** page, click **Save job and edit script**
- If this your first time, a **Script editor tips** page will pop up. Close the pop up page by clicking on the **x** symbol on the top right
- Copy and paste the LogCombiner script [log-combiner-glue-script.py](./log-combiner-glue-script.py) to AWS Glue script editor pane
- Click **Save**
- Click **Run job**
- Expand **Security configuration, script libraries, and job parameters** section on the popped up **Parameters(optional)** page
- Under **Job parameters**, type **--target_s3_bucket** into the text box under **Key**
- Into the text box under **Value**, type the name of the Amazon S3 bucket that you created at the beginning of this lab.
> :warning: Type only the name of the S3 bucket and **not** the Amazon S3 path starting with S3://
- Click **Run job**
- Close the script editor page by click on **X** symbol on the right hand side of the page
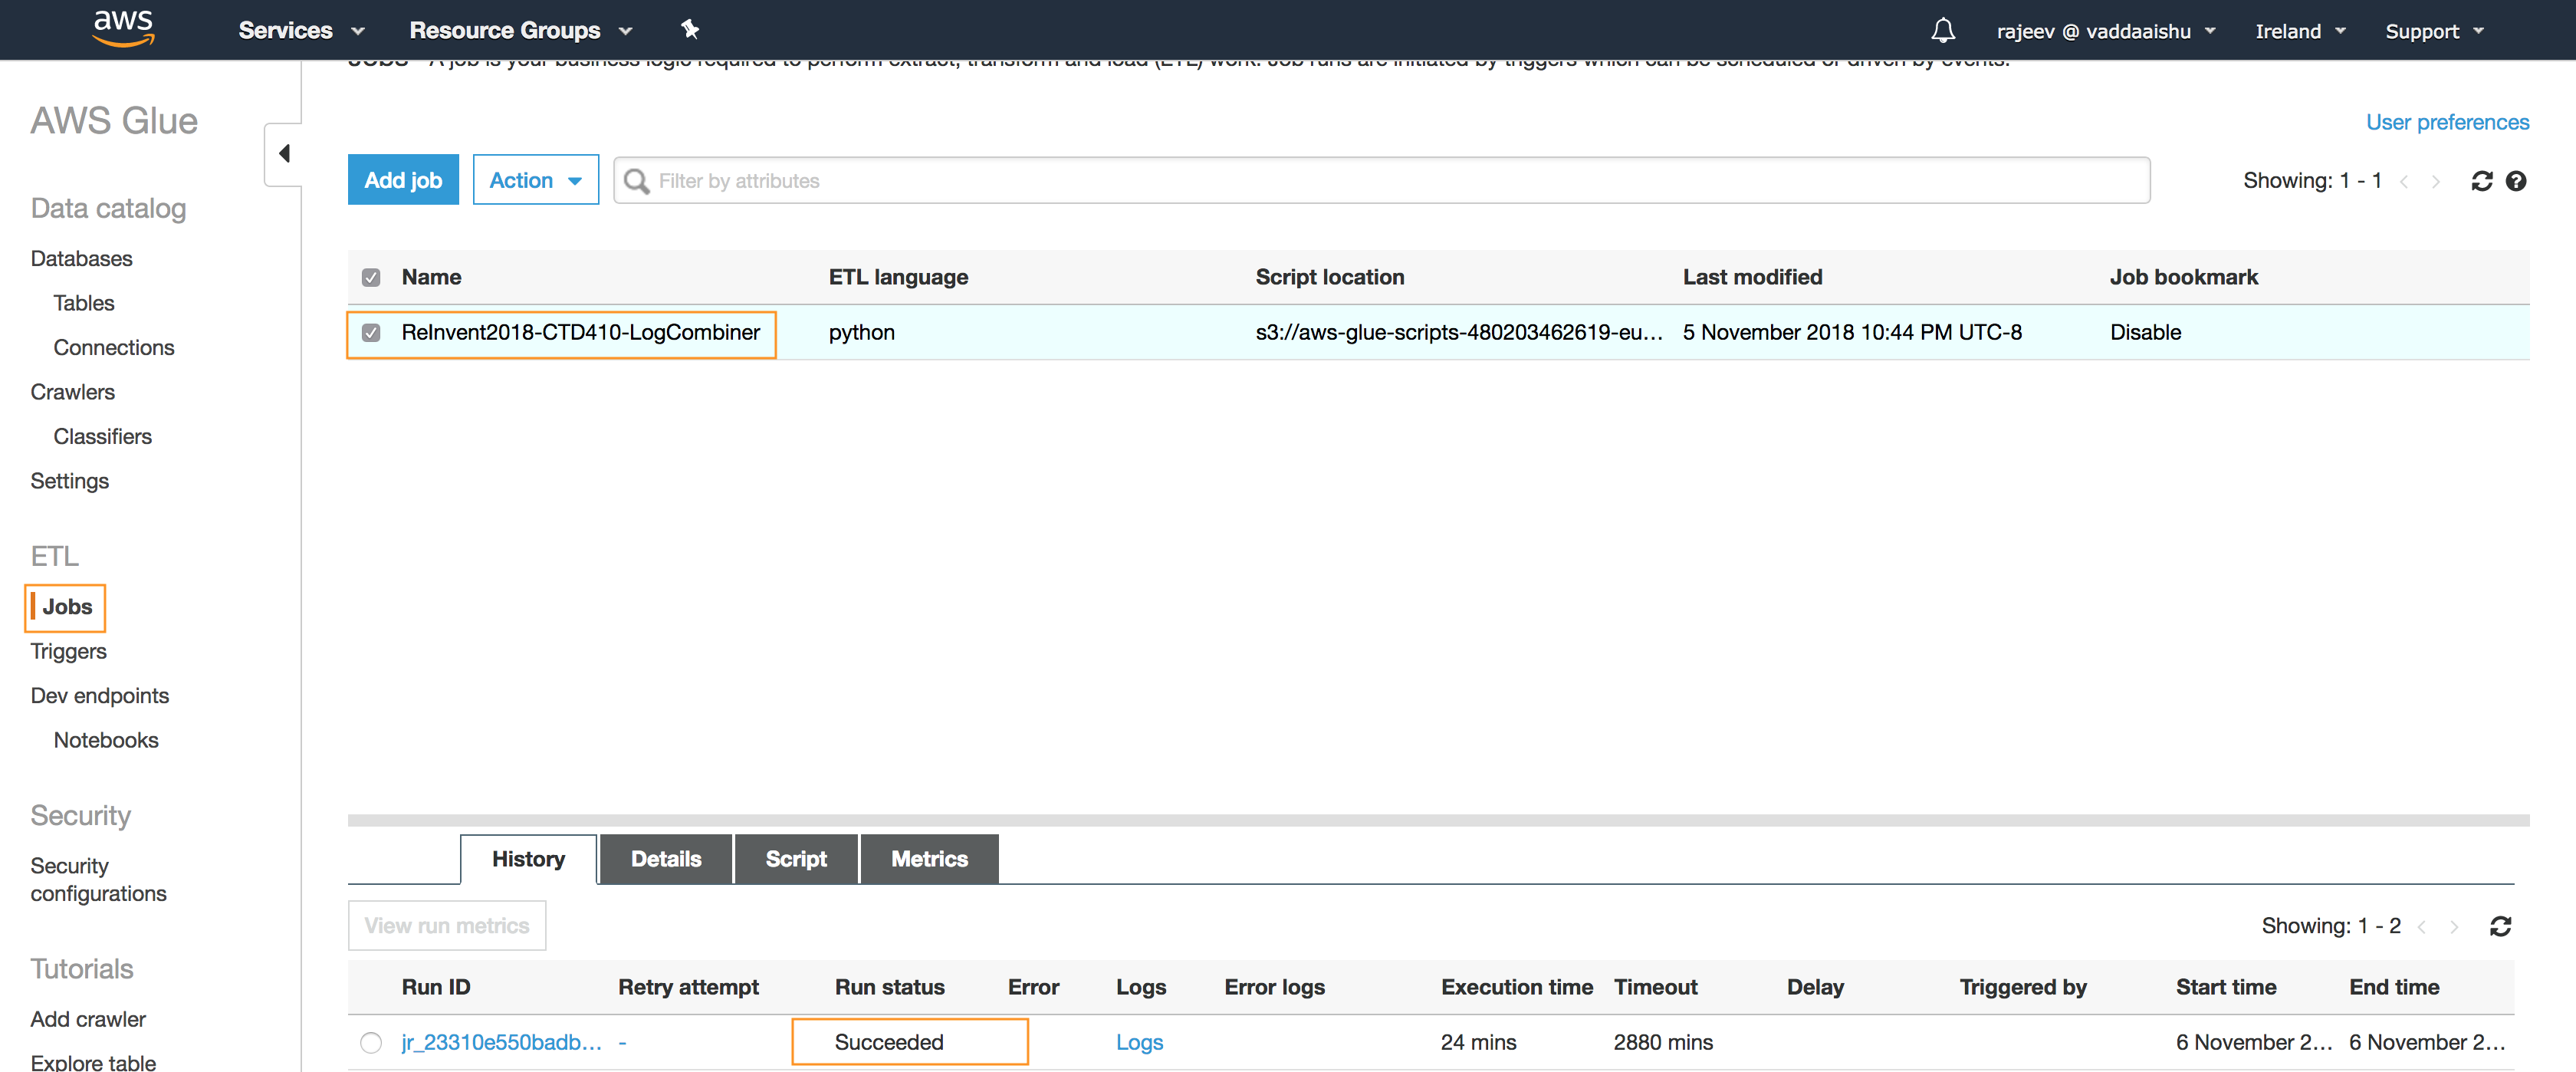
- On the Jobs pages check the box next to the name of the Glue ETL job *(e.g. ReInvent2018-CTD410-LogCombiner)* *to view the current status of the job under the **History** tab at the bottom of the page
- Ensure that the **Run status** is displaced as **Running**
- Wait until the Run status changes to **Succeeded**
> :warning: This step may take from upto 15 minutes to complete.
The AWS Glue ETL job performs an left outer join with the Amazon CloudFront access logs with the viewer request and origin triggered Lambda@Edge logs based on the 'requiestid' field. This is followed by another left outer join will Application Load Balancer (ALB) logs based on 'customtraceid' field in the Lambda@Edge logs and 'trace_id' field ALB logs. The duplicate fields in the logs are also removed. For more details, see [log-combiner-glue-script.py](./log-combiner-glue-script.py).
---
---
## Create AWS Glue Data Catalog for Combined Logs
Now that you have successfully generated the combined logs, in this section you will be creating an AWS Data Catalog tables pointing to the combined logs written by the AWS Glue ETL job that you just executed. You will be creating the following tables, loading the partitions into each of these tables, and previewing the fields.
|Table Name|Log Name|Partition|
|---|---|----|
|lambdaedge_logs_combined_optimized(optional)|Combined Lambda@Edge Logs obtained by joining viewer-request and origin-request logs |year, month, day, hour|
|combined_log_optimized|Combined all the four following logs - Amazon CloudFront access logs
- Viewer request triggered Lambda@Edge logs
- Origin request triggered Lambda@Edge logs
- Application Load Balancer(ALB)
|year, month, day|
The above AWS Glue data catalogs will be referred by AWS Athena service when you query the logs directly from Amazon S3 bucket for generating visualizations using Amazon QuickSight.
### Create AWS Glue Data Catalog for the combined logs using Amazon Athena
- In the query pane, copy the following statement to create a the *combined_log_optimized* table, and then choose **Run Query*:
> :warning: Replace in the query below with the unique name of the S3 Bucket you created in step 1 earlier.
```sql
CREATE EXTERNAL TABLE reInvent2018_aws_service_logs.combined_log_optimized(
received_bytes int,
trace_id string,
distributionname string,
executionregion string,
distributionid string,
location string,
sent_bytes int,
responseresulttype string,
xforwardedfor string,
type string,
customtraceid string,
querystring string,
client_ip_port string,
response_processing_time double,
elb string,
deviceformfactor string,
elb_status_code string,
uri string,
request_verb string,
col24 string,
request_url string,
region string,
hostheader string,
request_processing_time double,
resulttype string,
method string,
useragent string,
httpversion string,
target_status_code string,
target_ip_port string,
requestdata string,
host string,
referrer string,
cookie string,
bytes bigint,
target_processing_time double,
alb_time timestamp,
requestid string,
viewercountry string,
timetaken double,
requestbytes bigint,
target_group_arn string,
sslprotocol string,
requestprotocol string,
status int,
time timestamp,
requestip string,
sslcipher string,
request_proto string,
col25 string,
user_agent string)
PARTITIONED BY (
year string,
month string,
day string)
ROW FORMAT SERDE 'org.apache.hadoop.hive.ql.io.parquet.serde.ParquetHiveSerDe'
STORED AS PARQUET
LOCATION 's3:///combined/logs/'
TBLPROPERTIES("parquet.compress"="SNAPPY")
```
Now that you have created the table you need to add the partition metadata to the AWS Glue Catalog.
- Choose **New Query**, copy the following statement into the query pane, and then choose **Run Query** to add partition metadata.
```sql
MSCK REPAIR TABLE reInvent2018_aws_service_logs.combined_log_optimized
```
- Get the total number of combined log records:
```sql
SELECT count(*) AS rowcount FROM reInvent2018_aws_service_logs.combined_log_optimized
```
> :warning: Ensure that the rowcount = **207537**
- Get the first ten records:
```sql
SELECT * FROM reInvent2018_aws_service_logs.combined_log_optimized LIMIT 10
```
Click to expand to review the values in the following fields/columns as you will be using them in this workshop
|Field Name|Description|type
|---|----|---|
|requestid|An encrypted string that uniquely identifies a request. This field value is used to join the optimized CloudFront access logs with the optimized Lambda@Edge logs|string|
|trace_id|The contents of the X-Amzn-Trace-Id header, enclosed in double quotes. This field is used to join the optimized ALB logs with the optimized Lambda@Edge logs which in turn is used to correlate with the optimized CloudFront access logs using the requestId filed. For more information see [Request Tracing for Your Application Load Balancer](https://docs.aws.amazon.com/elasticloadbalancing/latest/application/load-balancer-request-tracing.html). Example value: ```X-Amzn-Trace-Id: Self=1-67891234-12456789abcdef012345678;Root=1-67891233-abcdef012345678912345678```|string|
|time|The time when the CloudFront server finished responding to the request (in UTC), for example, 01:42:39|timestamp|
|location|The edge location that served the request. Each edge location is identified by a three-letter code and an arbitrarily assigned number, for example, DFW3. The three-letter code typically corresponds with the International Air Transport Association airport code for an airport near the edge location. (These abbreviations might change in the future.) For a list of edge locations, see the Amazon CloudFront detail page, [http://aws.amazon.com/cloudfront](http://aws.amazon.com/cloudfront)|string|
|uri|The query string portion of the URI, if any. When a URI doesn't contain a query string, the value of cs-uri-query is a hyphen (-). For more information, see [Caching Content Based on Query String Parameters](https://docs.aws.amazon.com/AmazonCloudFront/latest/DeveloperGuide/QueryStringParameters.html).|string|
|status| One of the following values: - An HTTP status code (for example, 200). For a list of HTTP status codes, see [RFC 2616](http://www.w3.org/Protocols/rfc2616/rfc2616-sec10.html), [Hypertext Transfer Protocol—HTTP 1.1, section 10, Status Code Definitions]((http://www.w3.org/Protocols/rfc2616/rfc2616-sec10.html)). For more information, see [How CloudFront Processes and Caches HTTP 4xx and 5xx Status Codes from Your Origin](https://docs.aws.amazon.com/AmazonCloudFront/latest/DeveloperGuide/HTTPStatusCodes.html).
- 000, which indicates that the viewer closed the connection (for example, closed the browser tab) before CloudFront could respond to a request. If the viewer closes the connection after CloudFront starts to send the object, the log contains the applicable HTTP status code.
|string|
|useragent| The value of the User-Agent header in the request. The User-Agent header identifies the source of the request, such as the type of device and browser that submitted the request and, if the request came from a search engine, which search engine. For more information, see [User-Agent Header](https://docs.aws.amazon.com/AmazonCloudFront/latest/DeveloperGuide/RequestAndResponseBehaviorCustomOrigin.html#request-custom-user-agent-header).
|responseresulttype|How CloudFront classified the response just before returning the response to the viewer. Possible values include:- Hit – CloudFront served the object to the viewer from the edge cache.For information about a situation in which CloudFront classifies the result type as Hit even though the response from the origin contains a Cache-Control: no-cache header, see [Simultaneous Requests for the Same Object (Traffic Spikes)](https://docs.aws.amazon.com/AmazonCloudFront/latest/DeveloperGuide/RequestAndResponseBehaviorCustomOrigin.html#request-custom-traffic-spikes).
- RefreshHit – CloudFront found the object in the edge cache but it had expired, so CloudFront contacted the origin to determine whether the cache has the latest version of the object and, if not, to get the latest version.
- Miss – The request could not be satisfied by an object in the edge cache, so CloudFront forwarded the request to the origin server and returned the result to the viewer.
- LimitExceeded – The request was denied because a CloudFront limit was exceeded.
CapacityExceeded – CloudFront returned an HTTP 503 status code (Service Unavailable) because the CloudFront edge server was temporarily unable to respond to requests.- Error – Typically, this means the request resulted in a client error (sc-status is 4xx) or a server error (sc-status is 5xx).
- Redirect – CloudFront redirects from HTTP to HTTPS.If sc-status is 403 and you configured CloudFront to restrict the geographic distribution of your content, the request might have come from a restricted location. For more information about geo restriction, see [Restricting the Geographic Distribution of Your Content](https://docs.aws.amazon.com/AmazonCloudFront/latest/DeveloperGuide/georestrictions.html).If the value of x-edge-result-type is Error and the value of x-edge-response-result-type is not Error, the client disconnected before finishing the download.
|string|
|timetaken|The number of seconds (to the thousandth of a second, for example, 0.002) between the time that a CloudFront edge server receives a viewer's request and the time that CloudFront writes the last byte of the response to the edge server's output queue as measured on the server. From the perspective of the viewer, the total time to get the full object will be longer than this value due to network latency and TCP buffering.|double|
|request_processing_time|The total time elapsed (in seconds, with millisecond precision) from the time the load balancer received the request until the time it sent it to a target. This value is set to -1 if the load balancer can't dispatch the request to a target. This can happen if the target closes the connection before the idle timeout or if the client sends a malformed request. This value can also be set to -1 if the registered target does not respond before the idle timeout.| double|
|target_processing_time|The total time elapsed (in seconds, with millisecond precision) from the time the load balancer sent the request to a target until the target started to send the response headers. This value is set to -1 if the load balancer can't dispatch the request to a target. This can happen if the target closes the connection before the idle timeout or if the client sends a malformed request. This value can also be set to -1 if the registered target does not respond before the idle timeout. |double|
|response_processing_time|The total time elapsed (in seconds, with millisecond precision) from the time the load balancer received the response header from the target until it started to send the response to the client. This includes both the queuing time at the load balancer and the connection acquisition time from the load balancer to the client. This value is set to -1 if the load balancer can't send the request to a target. This can happen if the target closes the connection before the idle timeout or if the client sends a malformed request. |double|
|customtraceid|A uniquely generated value per request to join the ALB logs with Lambda@Edge logs. As part of client side instrumentation an unique value (Sample Value: ```Root=1-67891233-abcdef012345678912345678```) per request is generated and added two headers **x-my-trace-id** and **X-Amzn-Trace-Id**. The origin-request triggered Lambda@Edge function extract the **x-my-trace-id** header and logs the value. For more details see [Origin Request Trigger Lambda Function](./originRequest-Lambda/index.js). The **X-Amzn-Trace-Id** value is logged by the ALB. For more details refer, [Request Tracing for Your Application Load Balancer](https://docs.aws.amazon.com/elasticloadbalancing/latest/application/load-balancer-request-tracing.html). |string|
|viewercountry|Two letter country code based on IP address where the request came from. For more details [Configuring Caching Based on the Location of the Viewer](https://docs.aws.amazon.com/AmazonCloudFront/latest/DeveloperGuide/header-caching.html#header-caching-web-location). For an easy-to-use list of country codes, sortable by code and by country name, see the Wikipedia entry [ISO 3166-1 alpha-2](http://en.wikipedia.org/wiki/ISO_3166-1_alpha-2).|string|
|deviceformfactor|Category or form factor of the device based on the user agent associated with the request. For more details see [Configuring Caching Based on the Device Type](https://docs.aws.amazon.com/AmazonCloudFront/latest/DeveloperGuide/header-caching.html#header-caching-web-device). Possible values: - desktop
- mobile
- smarttv
- tablet
|string|
|year(partition)|The year on which the event occurred.|string|
|month(partition)|The month on which the event occurred.|string|
|day(partition)|The day on which the event occurred.|string|
---
### (Optional) Create AWS Glue Data Catalog for the combined Lamabda@Eddge logs using Amazon Athena
CLICK TO EXPAND FOR OPTIONAL SECTION
- Open the AWS Management Console for Athena from [here](https://console.aws.amazon.com/athena/home).
- In the query pane, copy the following statement to create a the *lambdaedge_logs_combined_optimized* table, and then choose **Run Query**:
> :warning: Replace in the query below with the unique name of the S3 Bucket you created in beginning of this lab.
```sql
CREATE EXTERNAL TABLE IF NOT EXISTS reInvent2018_aws_service_logs.lambdaedge_logs_combined_optimized(
executionregion string,
requestid string,
distributionid string,
distributionname string,
requestdata string,
customtraceid string,
useragentstring string,
deviceformfactor string,
viewercountry string)
PARTITIONED BY (
year string,
month string,
date string,
hour string)
ROW FORMAT SERDE 'org.apache.hadoop.hive.ql.io.parquet.serde.ParquetHiveSerDe'
STORED AS PARQUET
LOCATION 's3:///combined/lelogs/'
TBLPROPERTIES("parquet.compress"="SNAPPY")
```
Now that you have created the table you need to add the partition metadata to the AWS Glue Catalog.
1. Choose **New Query**, copy the following statement into the query pane, and then choose **Run Query** to add partition metadata.
```sql
MSCK REPAIR TABLE reInvent2018_aws_service_logs.lambdaedge_logs_combined_optimized
```
- Get the total number of combined Lambda@Edge Log records:
```sql
SELECT count(*) AS rowcount FROM reInvent2018_aws_service_logs.lambdaedge_logs_combined_optimized
```
> :warning: Ensure that the rowcount = **207837**
- Get the first ten records:
```sql
SELECT * FROM reInvent2018_aws_service_logs.lambdaedge_logs_combined_optimized LIMIT 10
```
After a few seconds, Athena will display your query results as shown below:
Click to expand to review the values in the following fields/columns
|Field Name|Description|type
|---|----|---|
|requestid|An encrypted string that uniquely identifies a request. This field value is used to join the optimized CloudFront access logs with the optimized Lambda@Edge logs. The requestId value also appears in CloudFront access logs as x-edge-request-id. For more information, see [Configuring and Using Access Logs](https://docs.aws.amazon.com/AmazonCloudFront/latest/DeveloperGuide/AccessLogs.html) and [Web Distribution Log File Format](https://docs.aws.amazon.com/AmazonCloudFront/latest/DeveloperGuide/AccessLogs.html#BasicDistributionFileFormat).|string|
|customtraceid|A uniquely generated value per request to join the ALB logs with Lambda@Edge logs. As part of client side instrumentation an unique value (Sample Value: ```Root=1-67891233-abcdef012345678912345678```) per request is generated and added two headers **x-my-trace-id** and **X-Amzn-Trace-Id**. The origin-request triggered Lambda@Edge function extract the **x-my-trace-id** header and logs the value. For more details see [Viewer Request Trigger Lambda Function](./viewerRequest-Lambda/index.js) and [Origin Request Trigger Lambda Function](./originRequest-Lambda/index.js) and . The **X-Amzn-Trace-Id** value is logged by the ALB. For more details refer, [Request Tracing for Your Application Load Balancer](https://docs.aws.amazon.com/elasticloadbalancing/latest/application/load-balancer-request-tracing.html). |string|
|executionregion|The AWS region where the Lambda@Edge function was executed.|string|
|eventtype|The type of trigger that's associated with the request. Possible Values - viewer-request
- origin-request
|string|
|distributionid|The ID of the distribution that's associated with the request.|string|
|distributionname|The domain name of the distribution that's associated with the request.|string|
|viewercountry|Two letter country code based on IP address where the request came from. For more details [Configuring Caching Based on the Location of the Viewer](https://docs.aws.amazon.com/AmazonCloudFront/latest/DeveloperGuide/header-caching.html#header-caching-web-location). For an easy-to-use list of country codes, sortable by code and by country name, see the Wikipedia entry [ISO 3166-1 alpha-2](http://en.wikipedia.org/wiki/ISO_3166-1_alpha-2).|string|
|deviceformfactor|Category or form factor of the device based on the user agent associated with the request. For more details see [Configuring Caching Based on the Device Type](https://docs.aws.amazon.com/AmazonCloudFront/latest/DeveloperGuide/header-caching.html#header-caching-web-device). Possible values: - desktop
- mobile
- smarttv
- tablet
|string|
|year(partition)|The year on which the event occurred.|string|
|month(partition)|The month on which the event occurred.|string|
|day(partition)|The day on which the event occurred.|string|
|hour(partition)|The hour on which the event occurred.|string|
---
---
## Visualization using Amazon QuickSight
### Signing Up for Amazon QuickSight Standard Edition
IF YOU HAVE NEVER USER AMAZON QUICKSIGHT WITHIN THIS ACCOUNT, CLICK TO EXPAND THE INSTRUCTIONS TO SIGN-UP FOR AN AMAZON QUICKSIGHT ACCOUNT
- Open the AWS Management console for Amazon QuickSight from [here](https://eu-west-1.quicksight.aws.amazon.com/sn/start)
- If this is the first time you are accessing QuickSight, you will see a sign-up landing page for QuickSight.
- Click on **Sign up for QuickSight**.
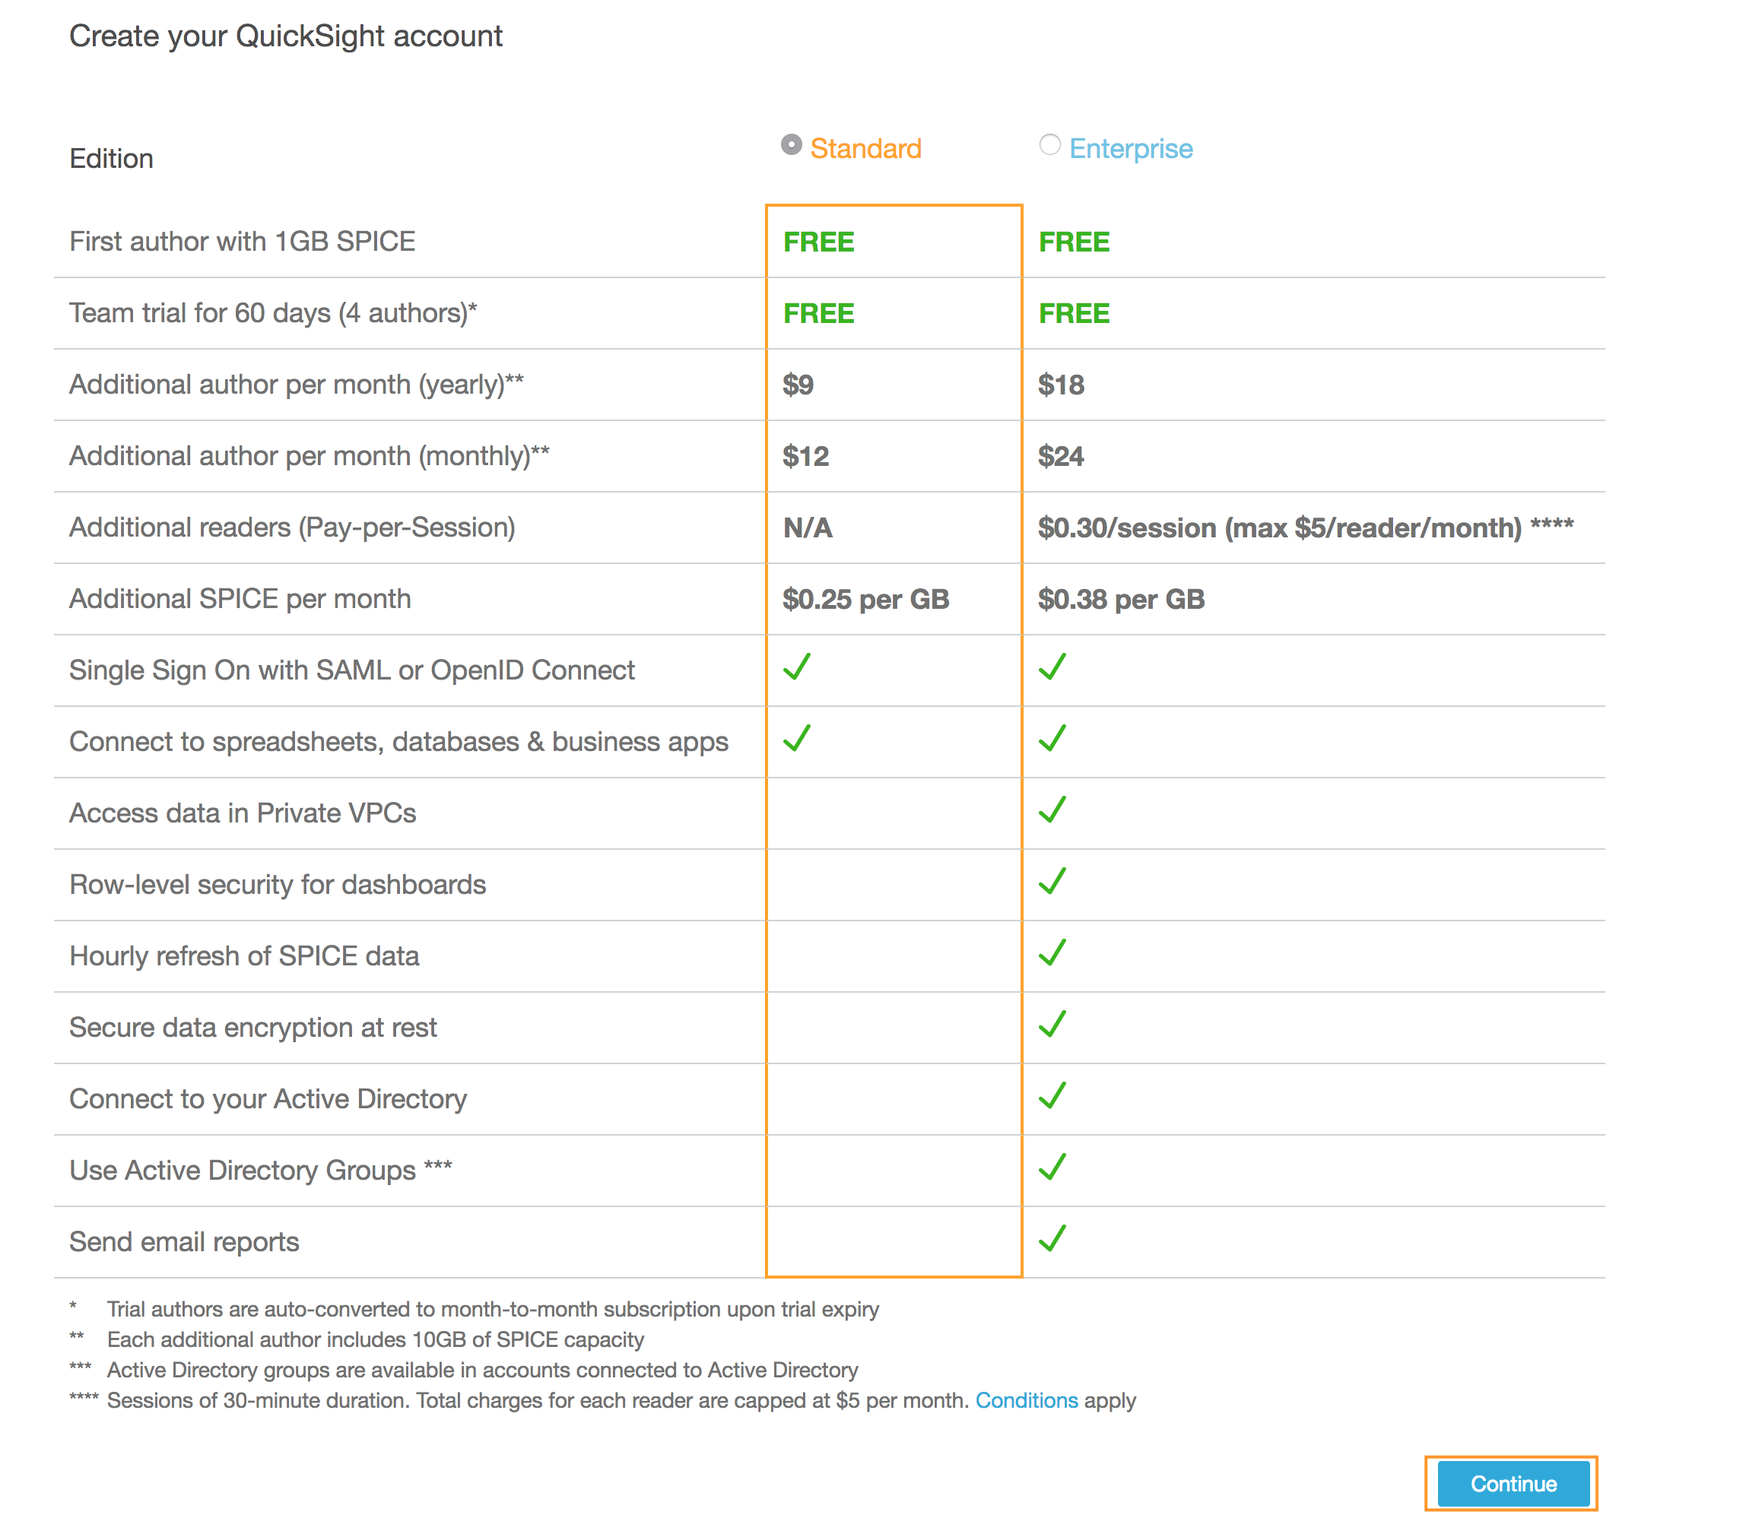
- On the **Create your QuickSight account** page, select **Standard Edition** for the subscription type.
- Click **Continue**
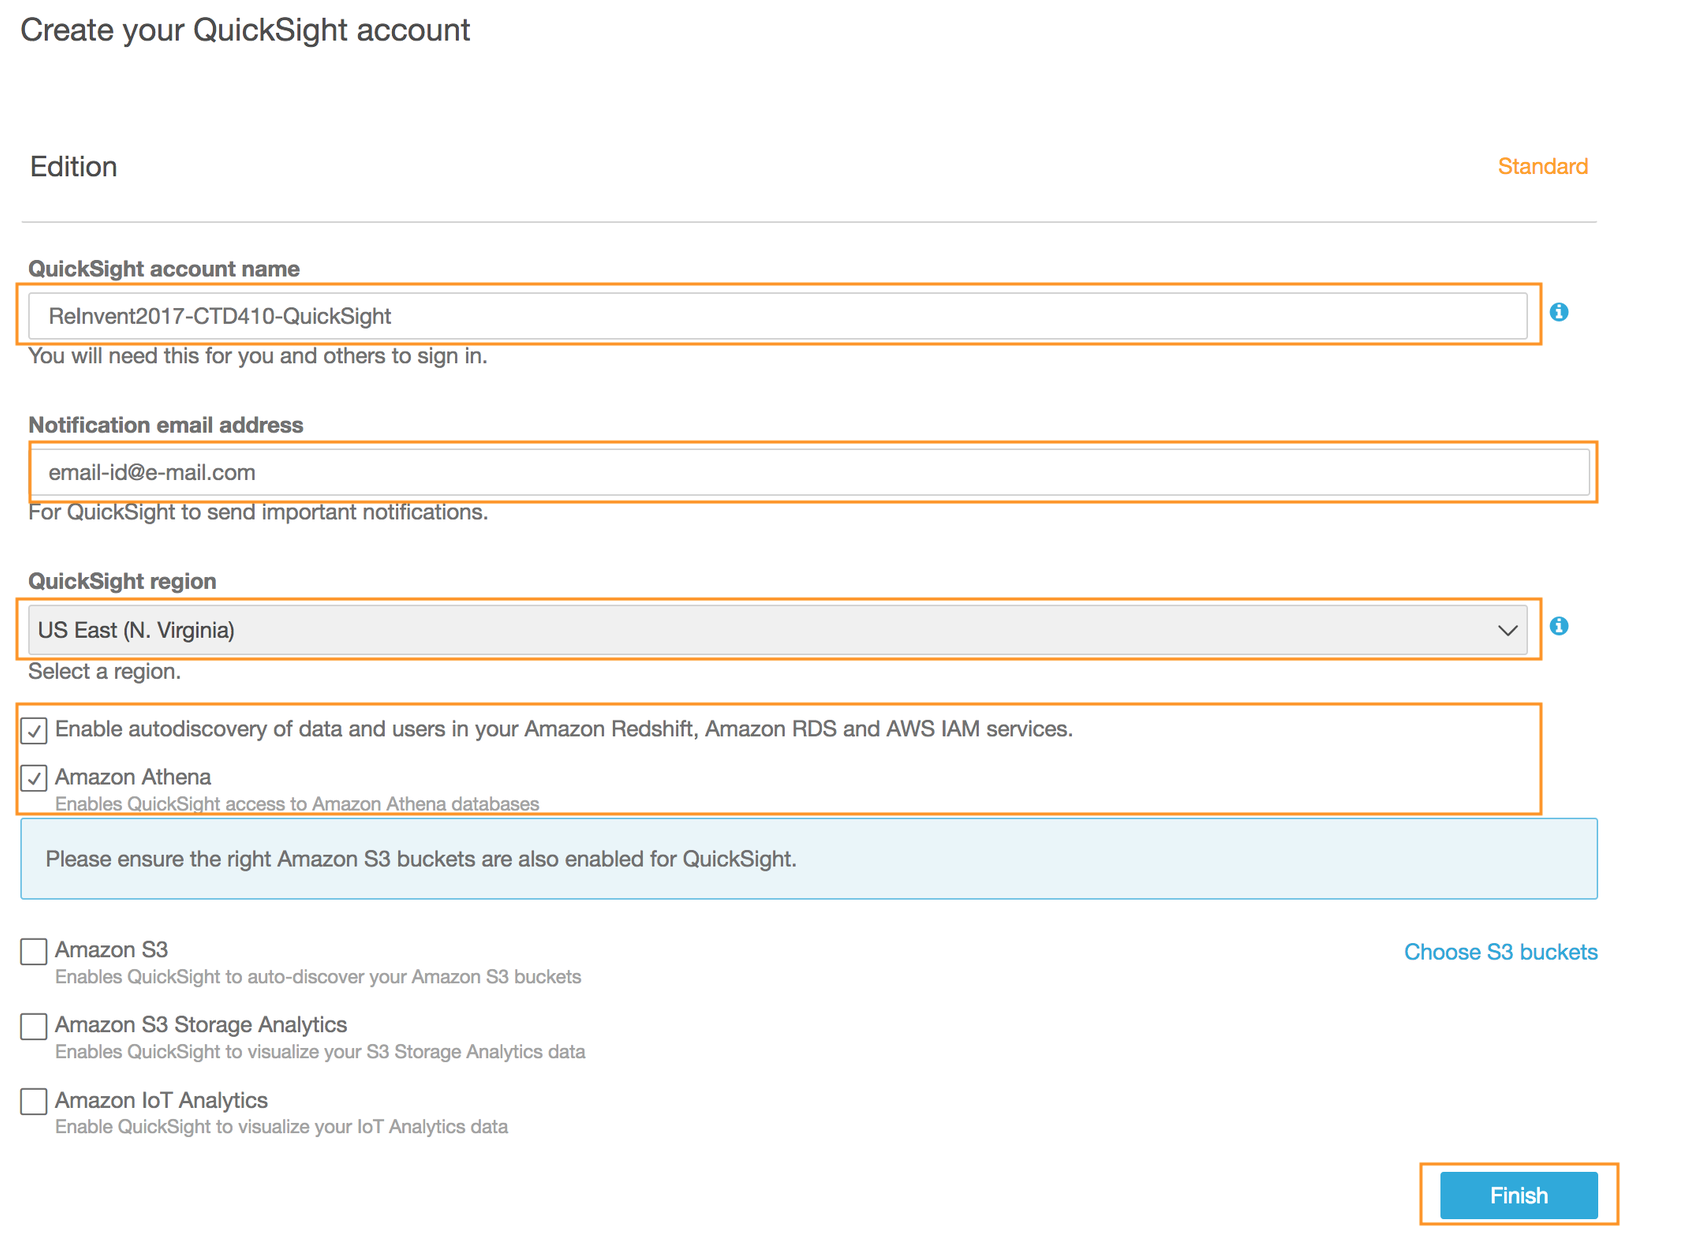
- On the next page, type a unique **QuickSight account name** *(e.g. REInvent2018-CTD410-QuickSight)*
- Type a valid email id for **Notification email address**
- Just for this step, ensure that **US East(N. Virginia)** is selected from the drop down menu for *QuickSight capacity region*
- Ensure that boxes next to **Enable autodiscovery of your data and users in your Amazon Redshift, Amazon RDS and AWS IAM Services** and **Amazon Athena** are checked
- Click **Finish**
- Wait until the page with message **Congratulations! You are signed up for Amazon QuickSight!** on successful sign up is presented.
- Click on **Go to Amazon QuickSight**.
---
### Configure Amazon S3 bucket Permission
In this section you will configure the permission for Amazon QuickSight to access the Amazon S3 bucket to read the combined logs that you generated as part of the ETL job.
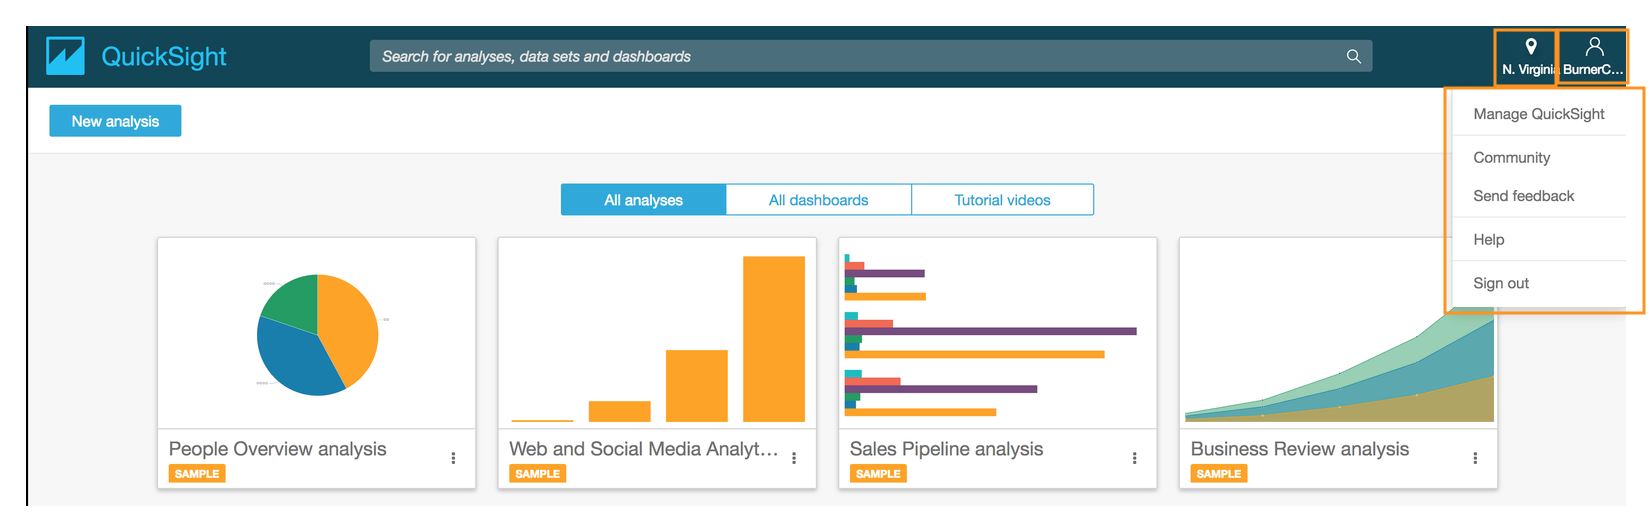
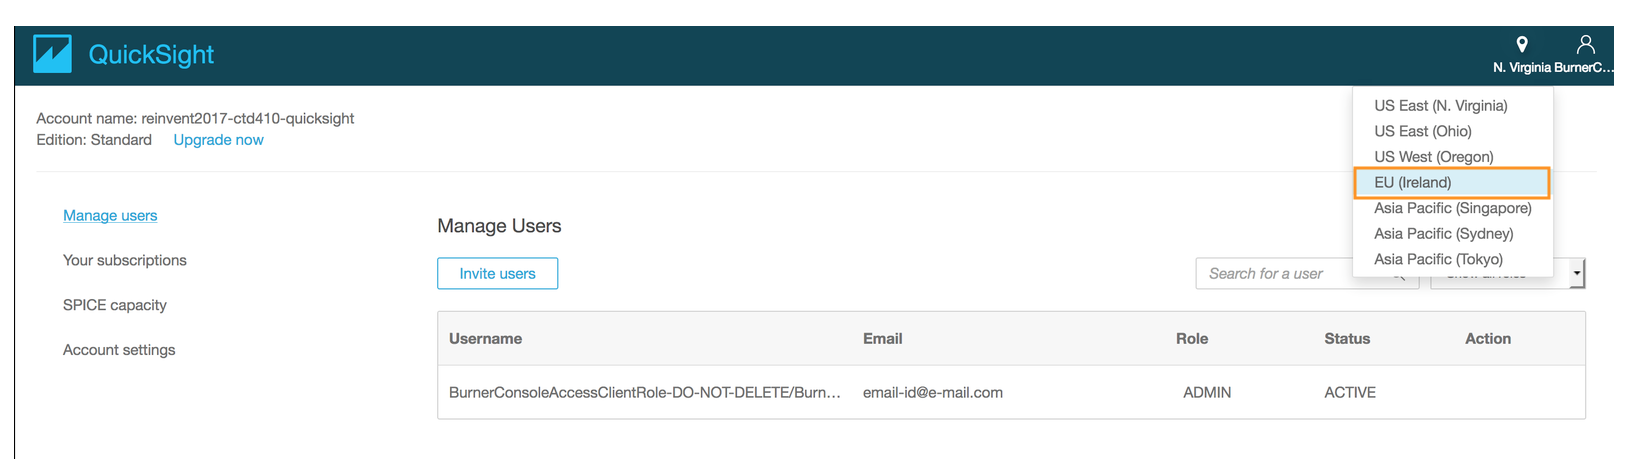
- On the Amazon QuickSight dashboard, navigate to user settings page on the top right section and click **Manage QuickSight**.
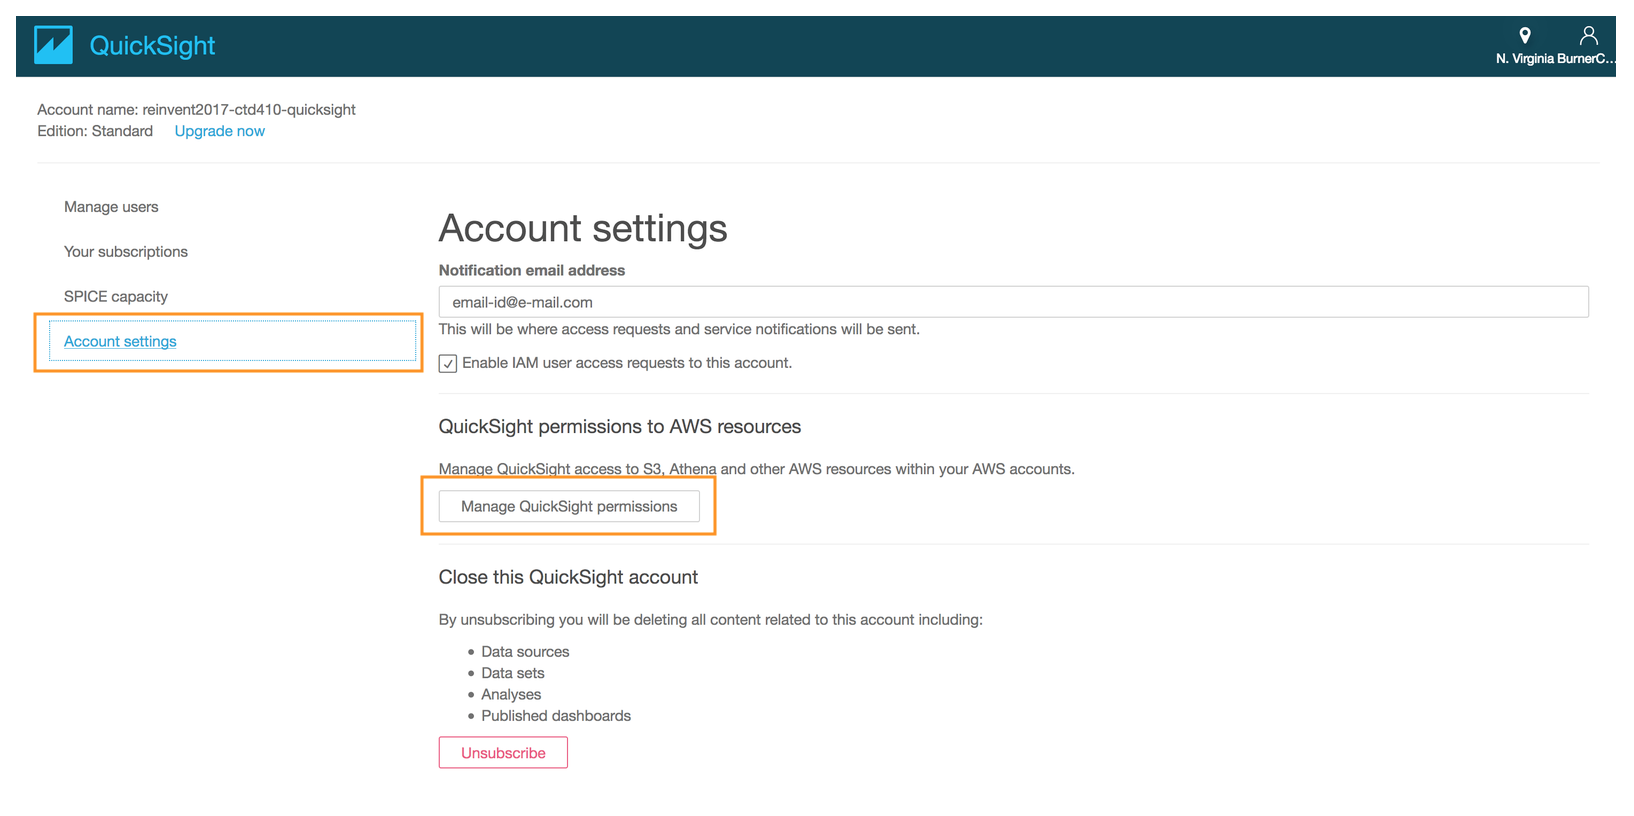
- On the next page, click on **Account Settings**
- Click on **Manage QuickSight permissions**
- Click **Choose S3 buckets** to select the Amazon S3 buckets for which auto-discovery needs to be enabled for QuickSight
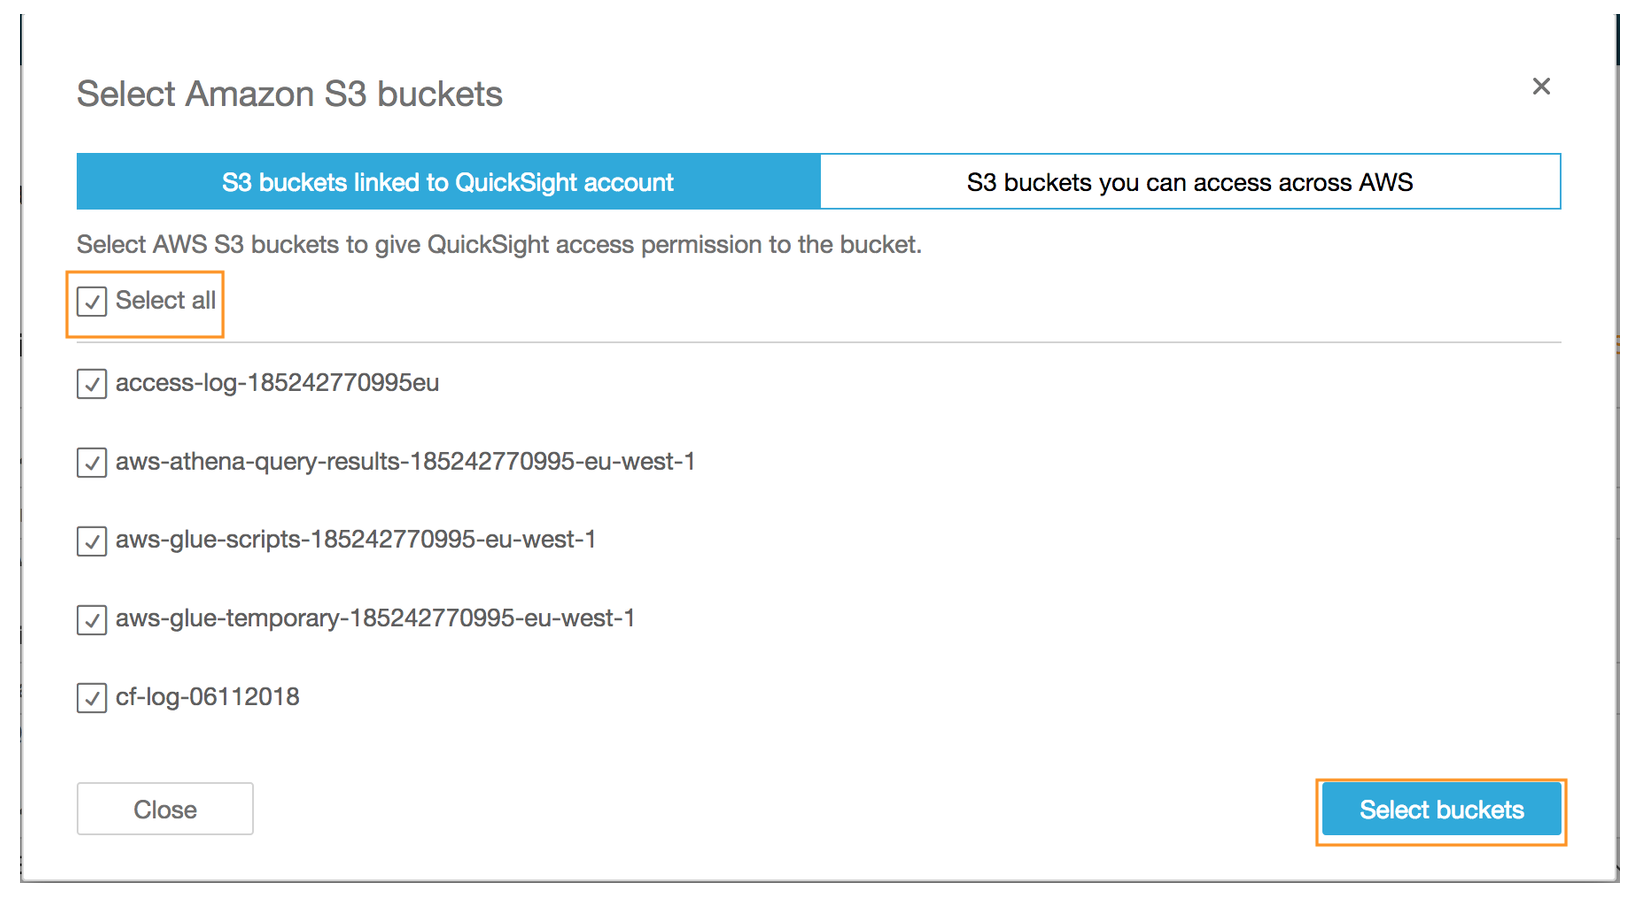
- On the pop up **Select Amazon S3 buckets** page check the box next to **Select all** or the name of the Amazon S3 bucket you created at the beginning of the lab
- Click **Select buckets**
- Ensure that the box next to **Amazon S3** is checked
- Click **Apply**
---
### Configuring Amazon QuickSight to use Amazon Athena as data source
In this section you will configure Amazon Athena as the data source to query the combined logs directly from Amazon S3 bucket by referencing the AWS Glue data catalog - *reInvent2018_aws_service_logs.combined_log_optimized*.
- Select **EU(Ireland)** as the region for this lab
- If this is first time you are using Amazon QuickSight in this region, close **Welcome to QuickSight** pop up page by clicking on the **x** symbol.
- Click on **Manage data** in the upper right hand corner
- Click on **New data set** on the upper left hand corner
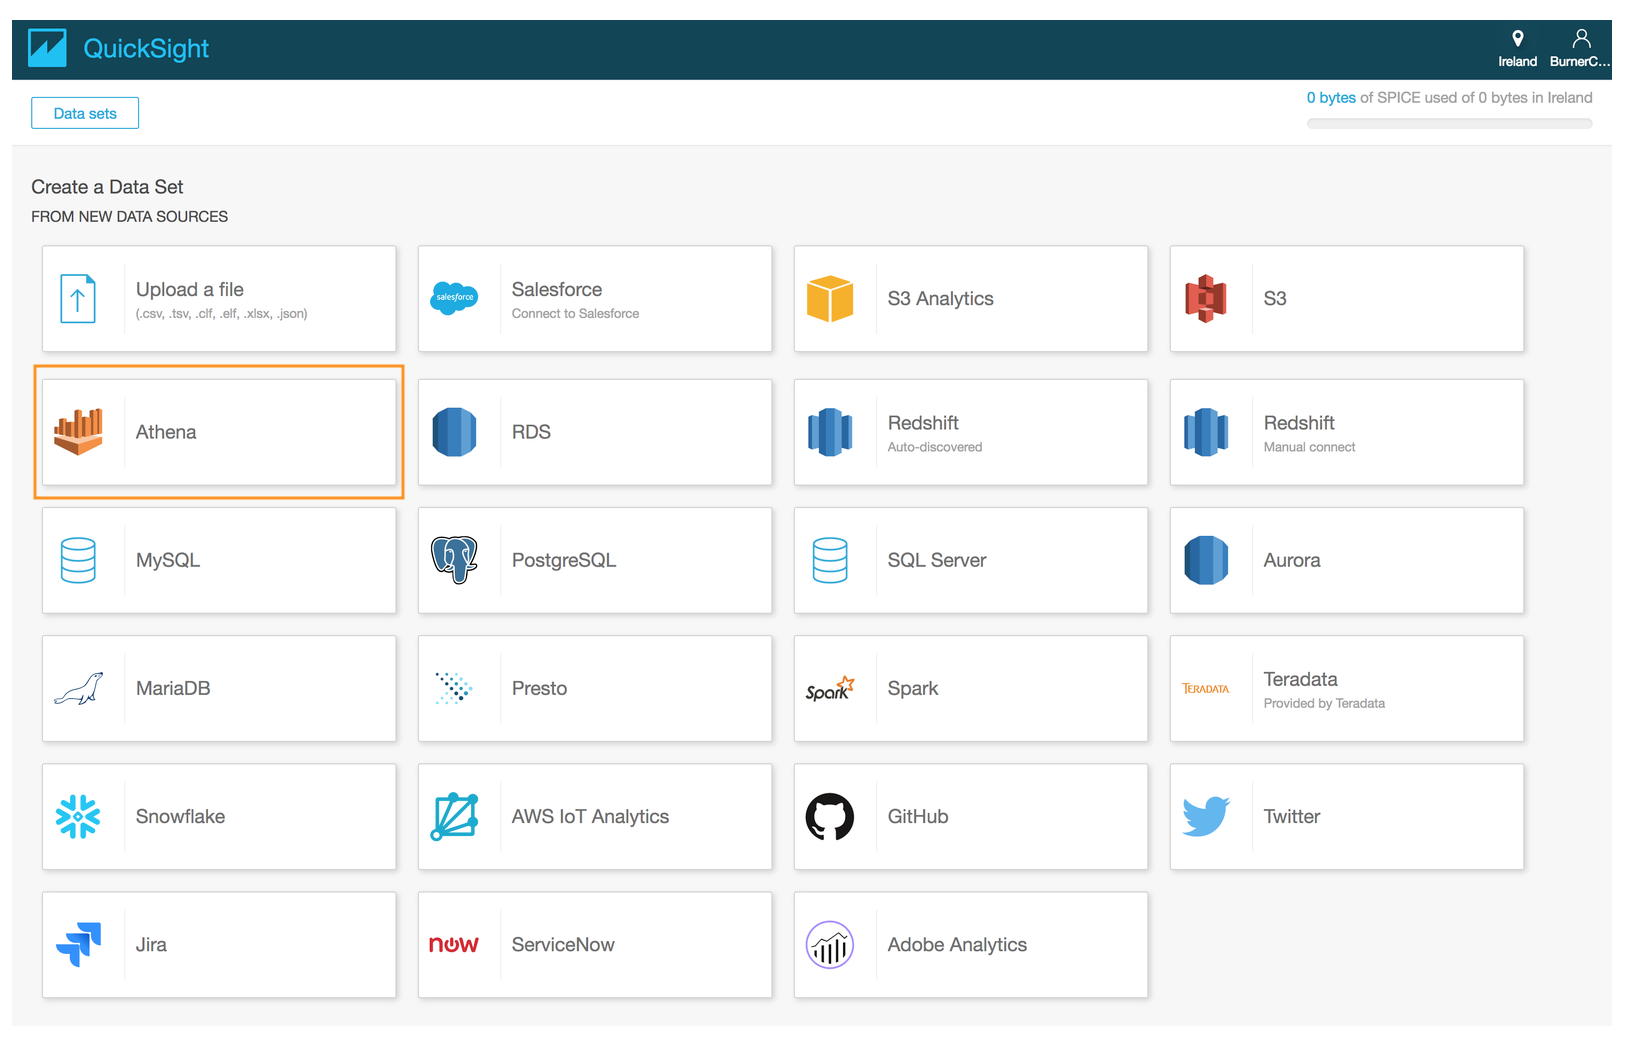
- Select **Athena** as the data source
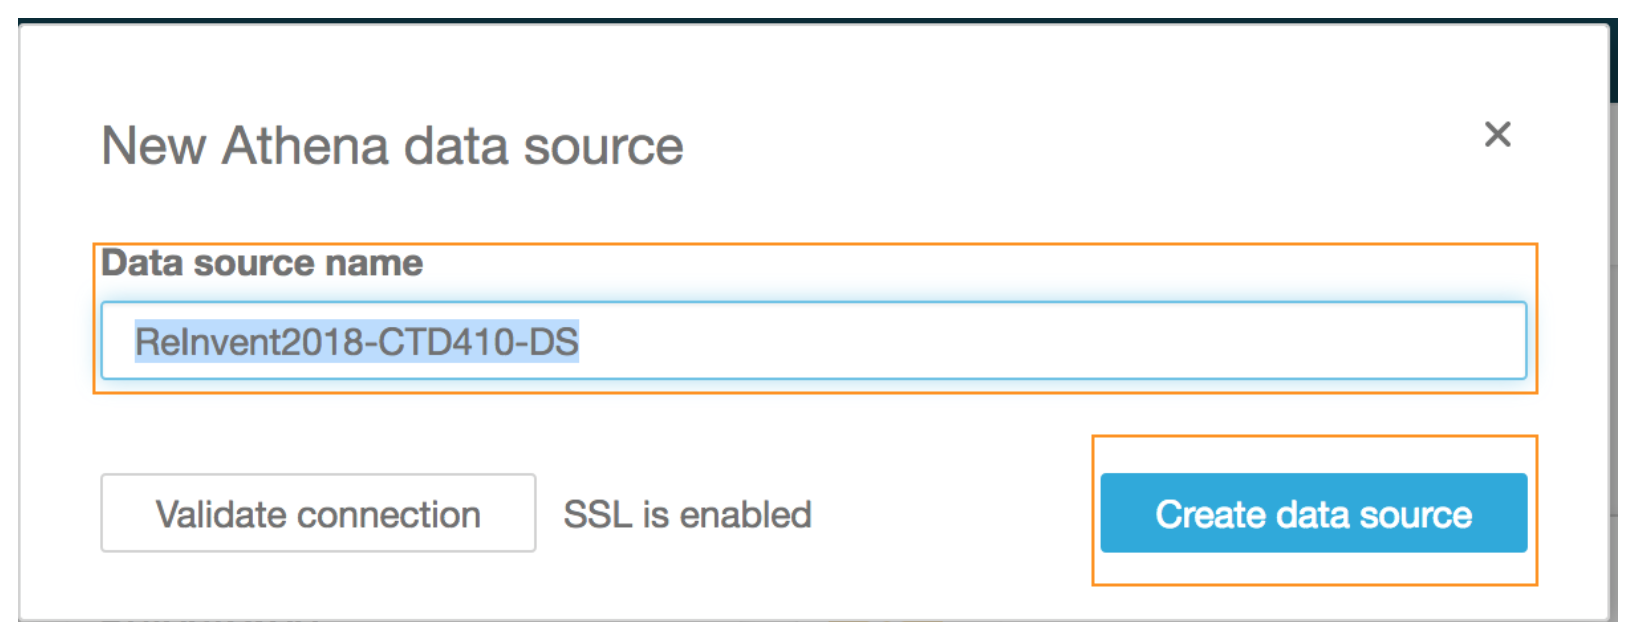
- Type a **Data source name** *(e.g. ReInvent-CTD410-DS)*
- Click on **Create data source**
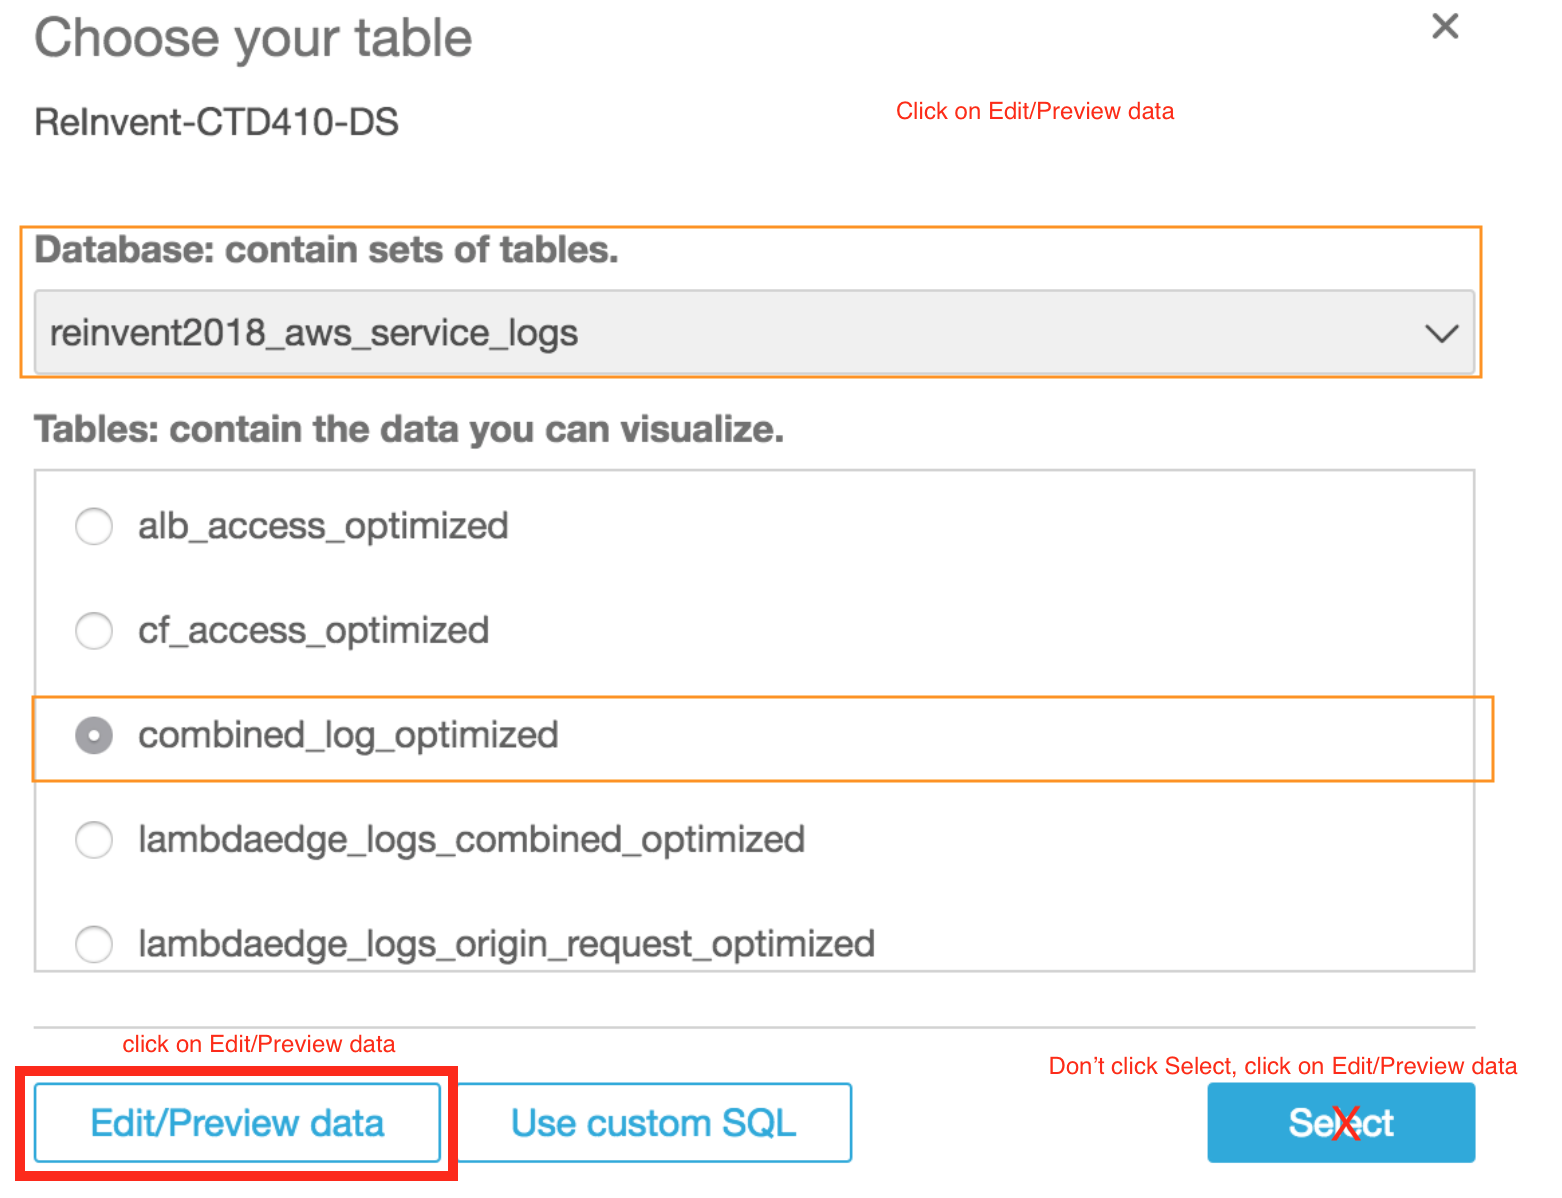
- Select **reinvent2018_aws_service_logs** from the drop down menu for **Database: contain sets of tables**
- Choose **combined_log_optimized** from the list under **Tables: contains the data you can visualize**
- Click **Edit/Preview data**
> :warning: **THIS IS A CRUCIAL STEP. PLEASE ENSURE YOU CHOOSE Edit/Preview data.**\
> :warning: **THIS IS A CRUCIAL STEP. PLEASE ENSURE YOU CHOOSE Edit/Preview data.**
---
---
## Generating new calculated fields in Amazon QuickSight
Now that you have configured the Amazon S3 permission and the data source in Amazon QuickSight, in this section you will generated following additional fields - HourOfDay, EdgeToOriginTimeTaken, TotalTimeTakenAtALB.
### Create new calculated fields “EdgeToOriginTimeTaken” in Amazon QuickSight
> **Formula:**\
> EdgeToOriginTimeTaken = timetaken - target_processing_time + response_processing_time + request_processing_time\
> = timetaken, when target_processing_time = null i.e. response was served by Amazon CloudFront\
> = 0, when (target_processing_time || response_processing_time || request_processing_time) == -1 (request timeout)
|Field Name|Description|type
|---|----|---|
|timetaken|The number of seconds (to the thousandth of a second, for example, 0.002) between the time that a CloudFront edge server receives a viewer's request and the time that CloudFront writes the last byte of the response to the edge server's output queue as measured on the server. From the perspective of the viewer, the total time to get the full object will be longer than this value due to network latency and TCP buffering.|double|
|request_processing_time|The total time elapsed (in seconds, with millisecond precision) from the time the load balancer received the request until the time it sent it to a target. This value is set to -1 if the load balancer can't dispatch the request to a target. This can happen if the target closes the connection before the idle timeout or if the client sends a malformed request. This value can also be set to -1 if the registered target does not respond before the idle timeout.| double|
|target_processing_time|The total time elapsed (in seconds, with millisecond precision) from the time the load balancer sent the request to a target until the target started to send the response headers. This value is set to -1 if the load balancer can't dispatch the request to a target. This can happen if the target closes the connection before the idle timeout or if the client sends a malformed request. This value can also be set to -1 if the registered target does not respond before the idle timeout. |double|
|response_processing_time|The total time elapsed (in seconds, with millisecond precision) from the time the load balancer received the response header from the target until it started to send the response to the client. This includes both the queuing time at the load balancer and the connection acquisition time from the load balancer to the client. This value is set to -1 if the load balancer can't send the request to a target. This can happen if the target closes the connection before the idle timeout or if the client sends a malformed request. |double|
- Open the AWS Management console for Amazon QuickSight from [here](https://eu-west-1.quicksight.aws.amazon.com/sn/start)
- Under **Fields** on the left column, click **Add calculated field**
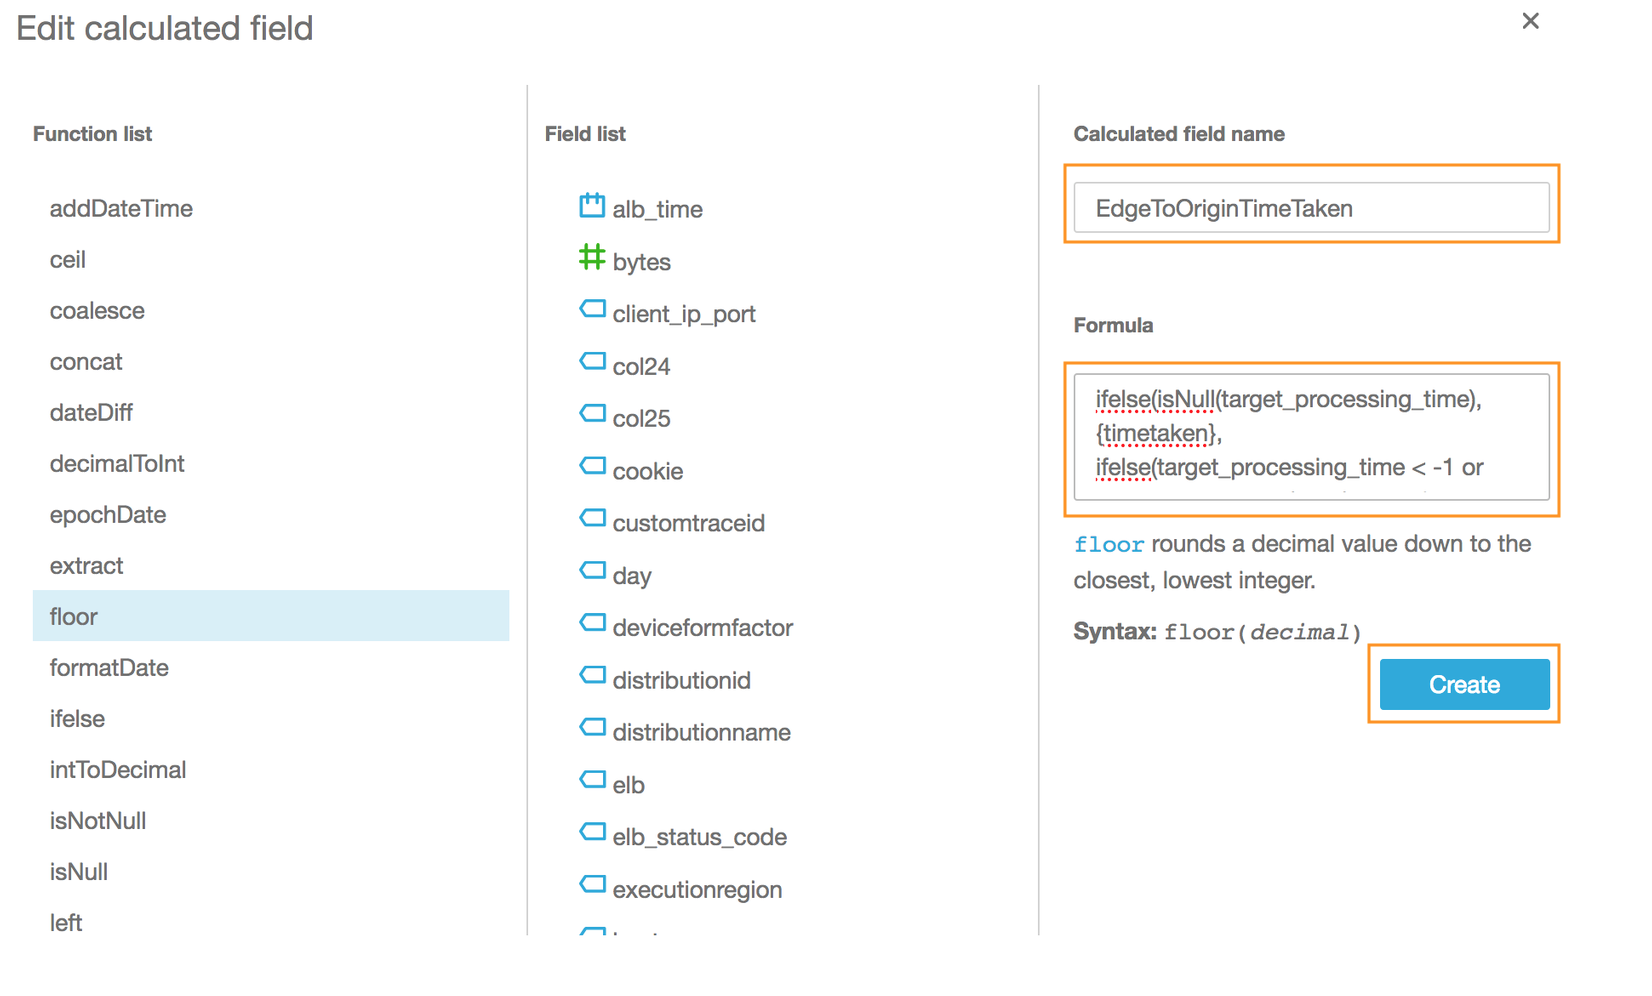
- In the **Add calculated field** pop up page, type **EdgeToOriginTimeTaken** under **Calculated field name**
- Copy and paste the formula below in the **Formula** text box
```$xslt
ifelse(isNull(target_processing_time), {timetaken}, ifelse(target_processing_time = -1 or response_processing_time = -1 or request_processing_time = -1, 0, {timetaken} - {target_processing_time} + {response_processing_time} +{request_processing_time}))
```
- Click **Create**
- Ensure that **#EdgeToOriginTimeTaken** appears under *Calculated fields*
---
### Create new calculated fields "HourOfDay" in Amazon QuickSight
> ** Formula:**\
> HourofDay = extract("HH",{time})
|Field Name|Description|type
|---|----|---|
|time|The time when the CloudFront server finished responding to the request (in UTC), for example, 01:42:39|timestamp|
- Under **Fields** on the left column, click **Add calculated field**
- In the **Add calculated field** pop up page, type **HourOfDay** under **Calculated field name**
- Copy and paste the formula below in the **Formula** text box
```$xslt
extract("HH",{time})
```
- Click **Create**
- Ensure that **#HourOfDay** *appears under **Calculated fields**
---
### Create new calculated fields "TotalTimeTakenAtALB" in Amazon QuickSight
> **Formula**\
> TotalTimeTakenAtALB = target_processing_time + response_processing_time + request_processing_time\
> = 0, when target_processing_time = null i.e. response was served by Amazon CloudFront\
> = 0, when (target_processing_time || response_processing_time || request_processing_time) == -1 (request timeout)
|Field Name|Description|type
|---|----|---|
|timetaken|The number of seconds (to the thousandth of a second, for example, 0.002) between the time that a CloudFront edge server receives a viewer's request and the time that CloudFront writes the last byte of the response to the edge server's output queue as measured on the server. From the perspective of the viewer, the total time to get the full object will be longer than this value due to network latency and TCP buffering.|double|
|request_processing_time|The total time elapsed (in seconds, with millisecond precision) from the time the load balancer received the request until the time it sent it to a target. This value is set to -1 if the load balancer can't dispatch the request to a target. This can happen if the target closes the connection before the idle timeout or if the client sends a malformed request. This value can also be set to -1 if the registered target does not respond before the idle timeout.| double|
|target_processing_time|The total time elapsed (in seconds, with millisecond precision) from the time the load balancer sent the request to a target until the target started to send the response headers. This value is set to -1 if the load balancer can't dispatch the request to a target. This can happen if the target closes the connection before the idle timeout or if the client sends a malformed request. This value can also be set to -1 if the registered target does not respond before the idle timeout. |double|
|response_processing_time|The total time elapsed (in seconds, with millisecond precision) from the time the load balancer received the response header from the target until it started to send the response to the client. This includes both the queuing time at the load balancer and the connection acquisition time from the load balancer to the client. This value is set to -1 if the load balancer can't send the request to a target. This can happen if the target closes the connection before the idle timeout or if the client sends a malformed request. |double|
- Under **Fields** on the left column, click **Add calculated field**
- In the **Add calculated field** pop up page, type **TotalTimeTakenAtALB** under **Calculated field name**
- Copy and paste the formula below in the **Formula** text box
```$xslt
ifelse(isNull(target_processing_time), 0, ifelse(target_processing_time = -1 or response_processing_time = -1 or request_processing_time = -1, 0, {target_processing_time} + {response_processing_time} +{request_processing_time}))
```
- Click **Create**
- Ensure that **#TotatlTimeTakenAtALB** appears under **Calculated fields**
- Click on **Save & visualize** on the top of the page
---
---
## Generate visualization using Amazon QuickSight
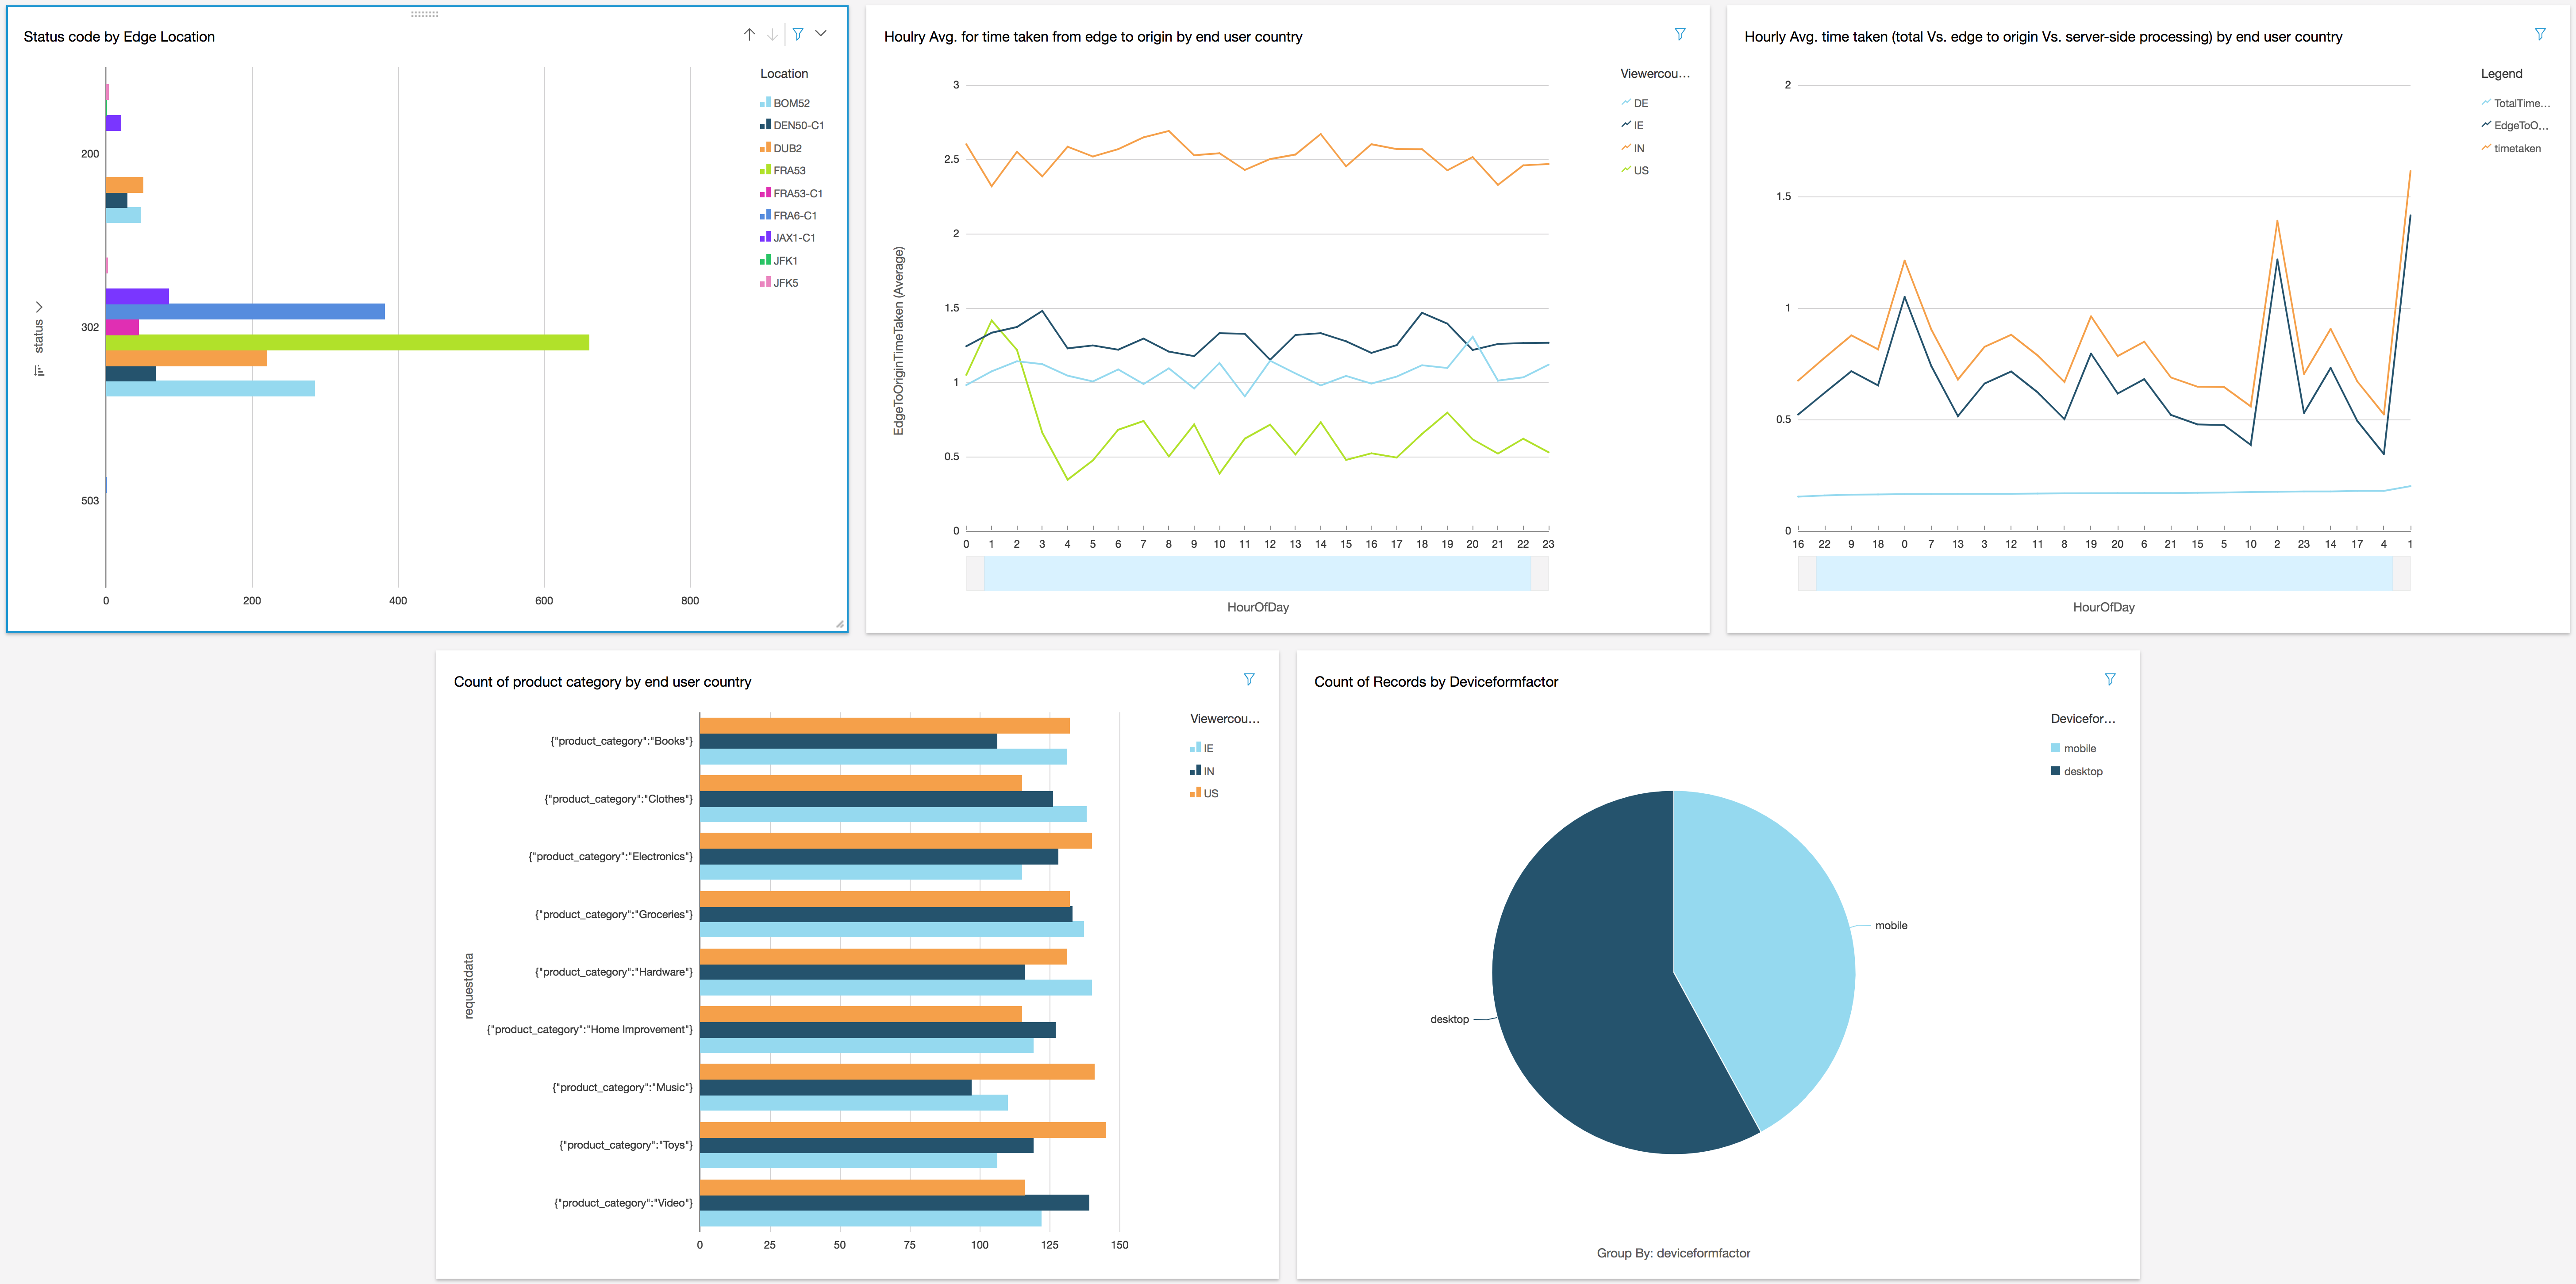
Now that you have configure Athena as the data source to query the combined logs directly from Amazon S3 and created additional fields in Amazon QuickSight, you are ready to generation visualization for the following use cases:
* Status code count by Amazon CloudFront Edge / PoP
* Status code count by user requested URI
* Time taken (averaged over hour) from Amazon CloudFront edge to origin (located in AWS region us-east-1 (N. Virginia)) by country where the user request originated from
* Total time taken (averaged over hour) Vs. time taken (averaged over hour) from Amazon CloudFront edge to origin (located in AWS region us-east-1 (N. Virginia)) Vs. total server-side processing time (averaged over hour) for a country where the user request originated from
* Count of product category request by the country where the request originated from
* Ratio of device form factors used to browse globally or for a country where the user request originated from
### Generate visualization to status code count by Amazon CloudFront Edge/PoP
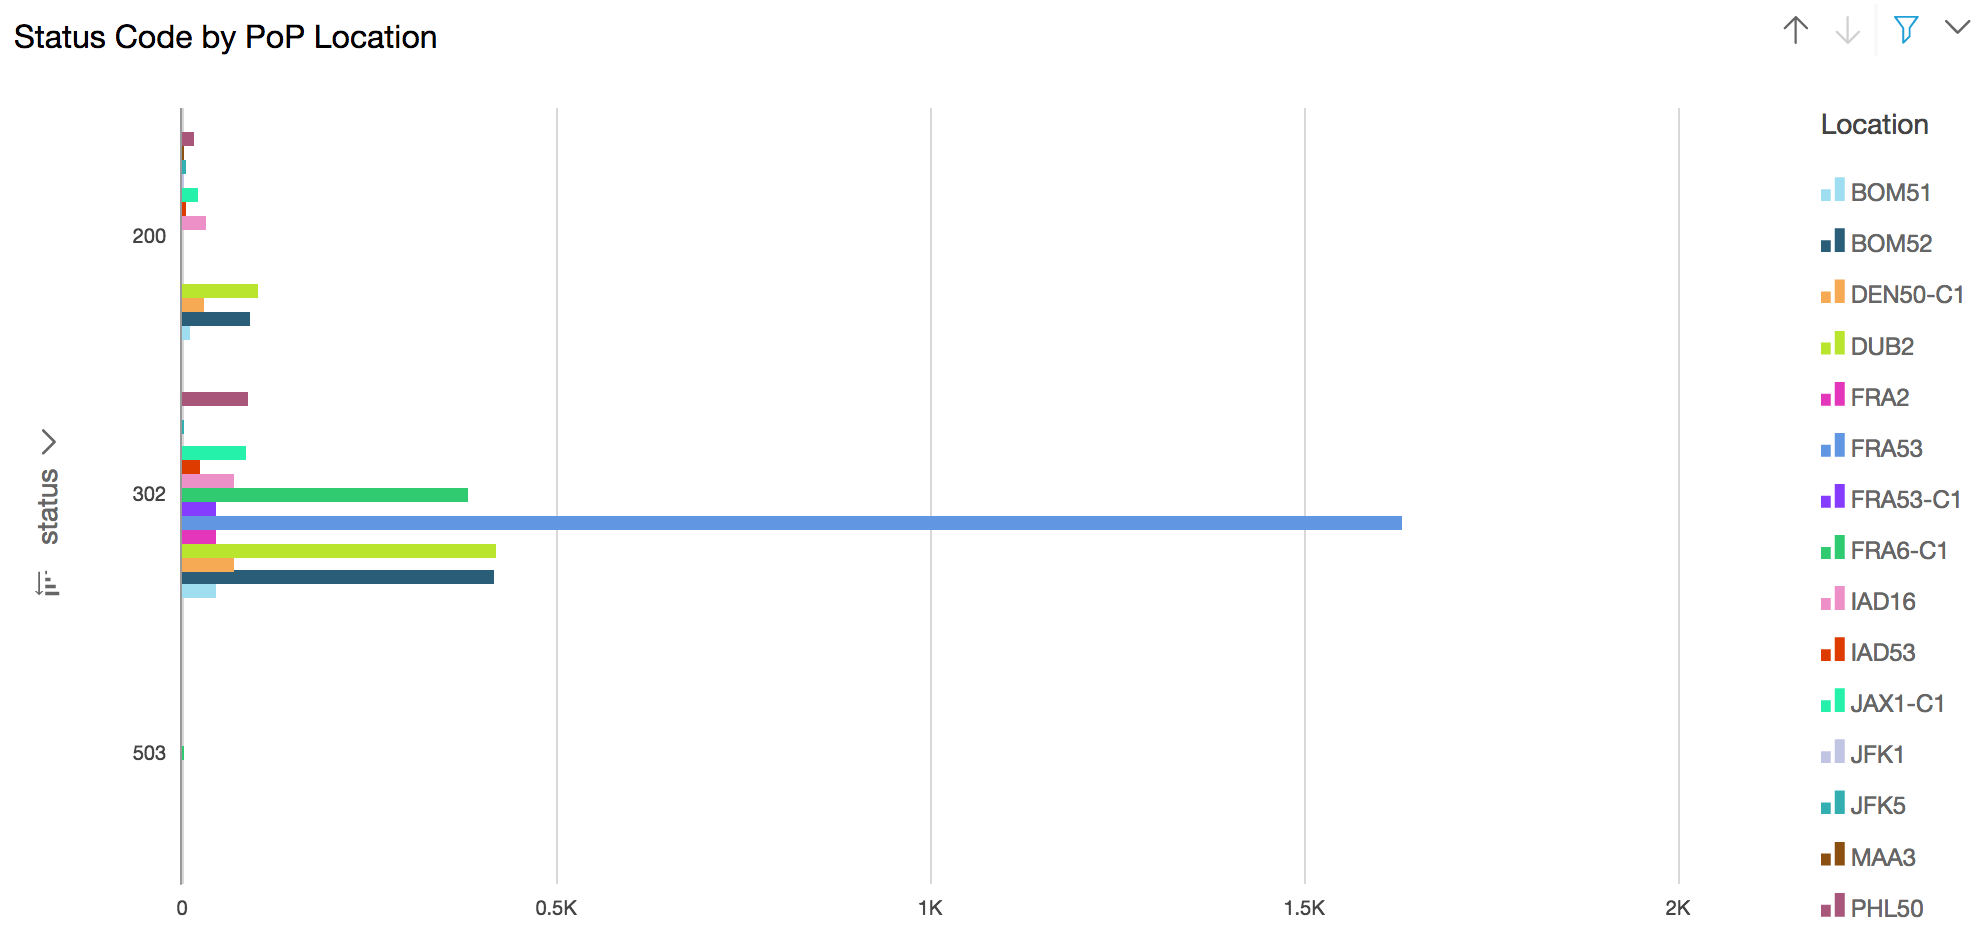
**Use case:** HTTP Status Codes (3xx, 4xx, 5xx) error code by Edge/PoP location can provide insight in troubleshooting issue (such as connectivity etc.)
- Ensure that the selected region is **Ireland** in top right corner
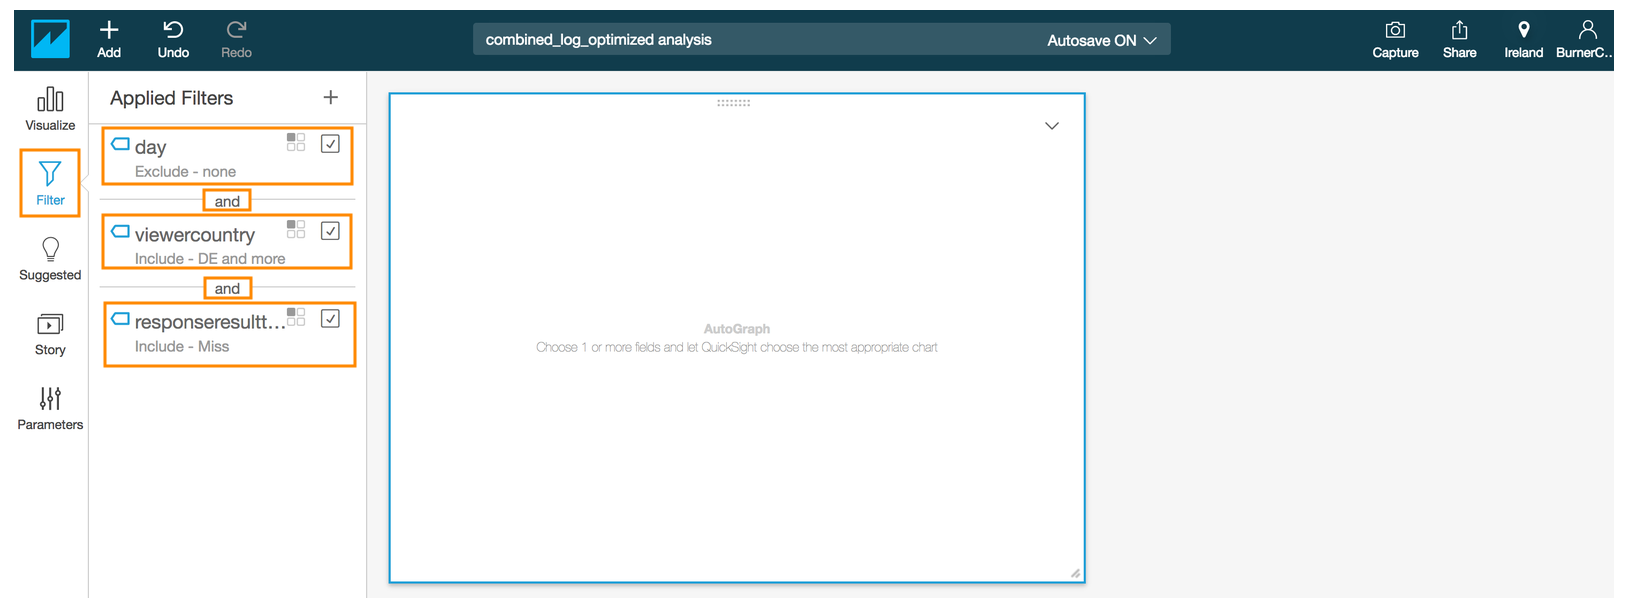
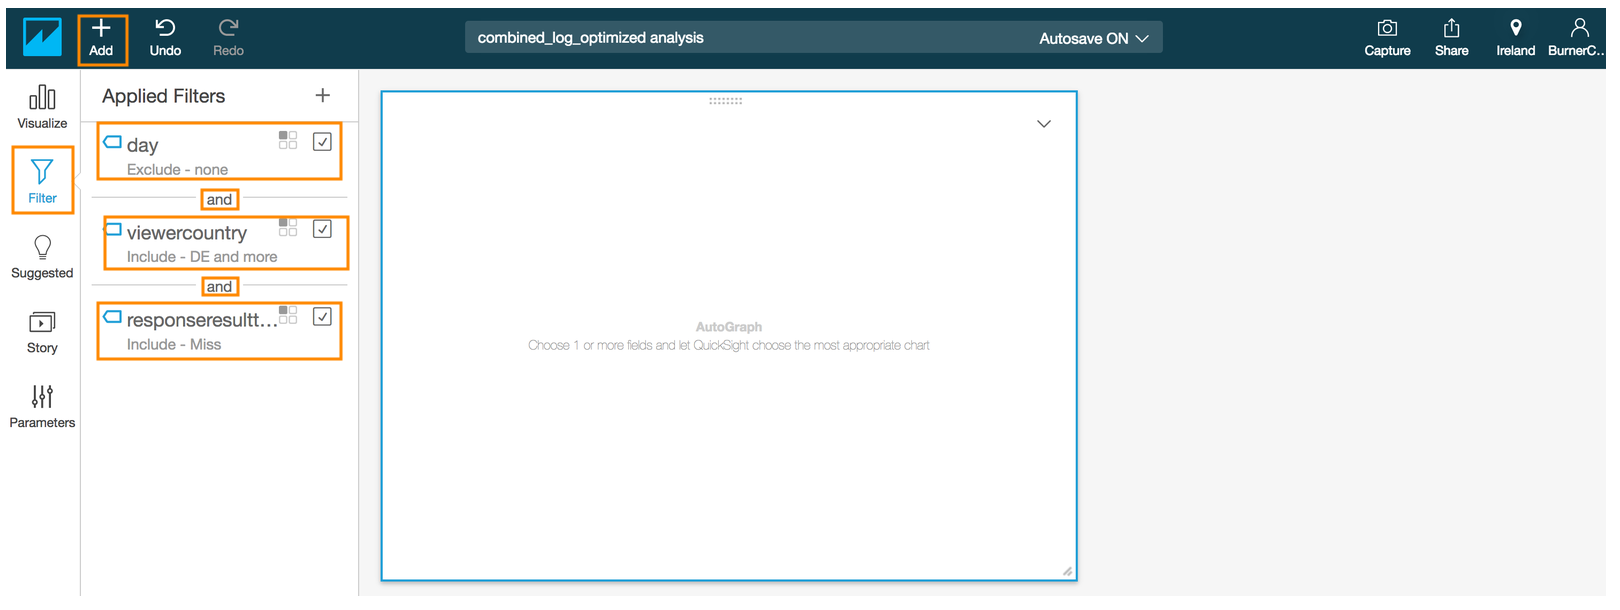
- Click the **Filter** icon in the QuickSight navigation pane
- Click on **+** symbol next to **Applied Filters**
- Select **day** field in the pop up menu
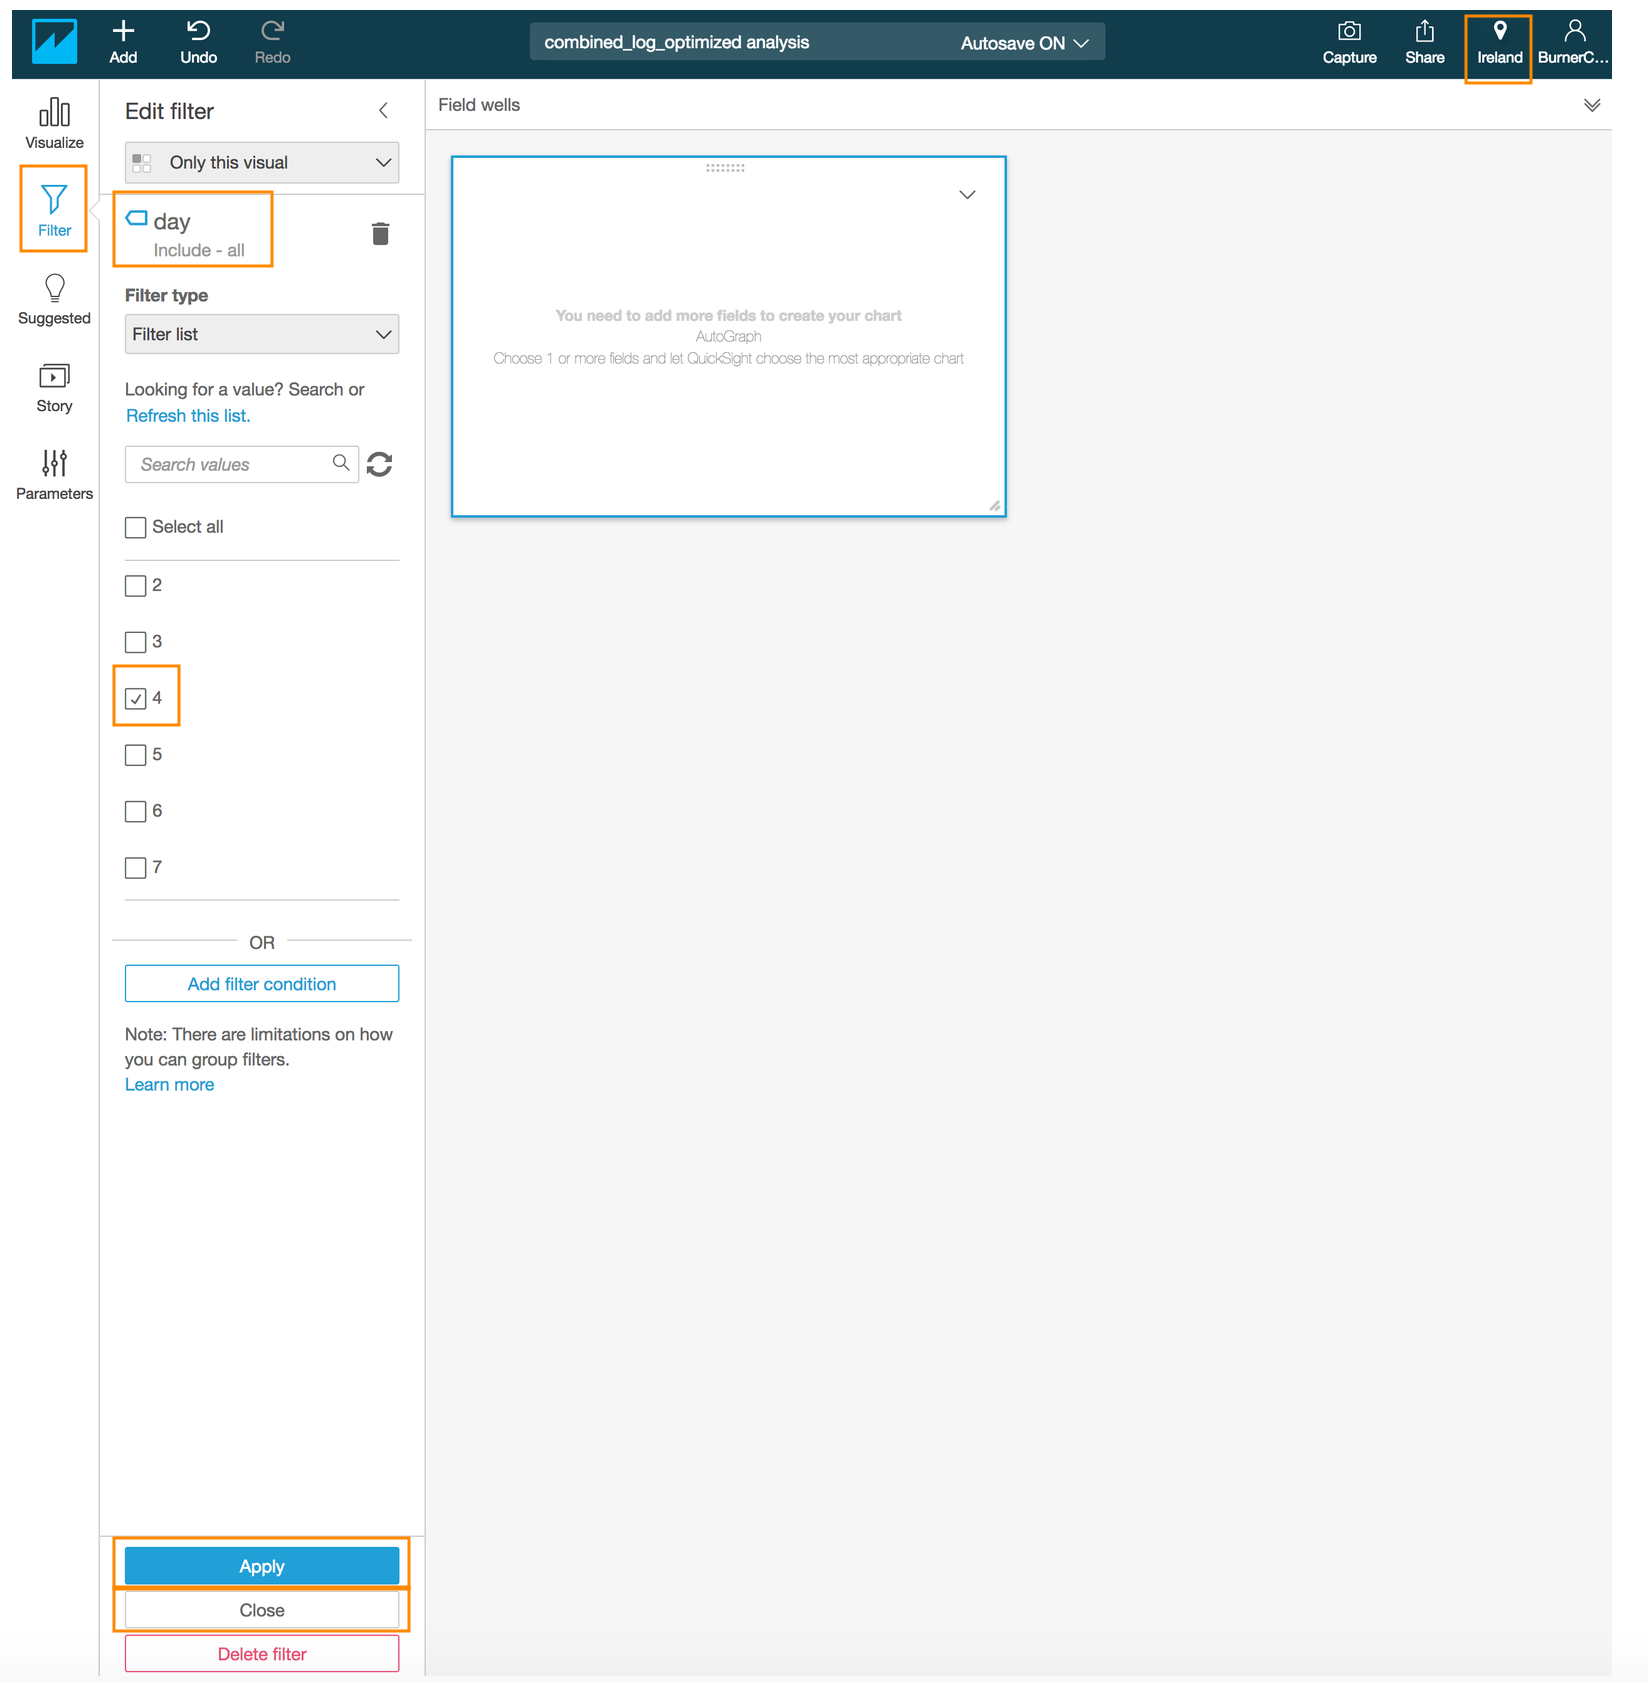
- Choose the new filter that you just created by clicking on filter name **day**
- Wait for QuickSight to load the filter values and then check the box next to one of the values for the day field *(e.g. 4)*
- Click **Apply**
- Click **Close**
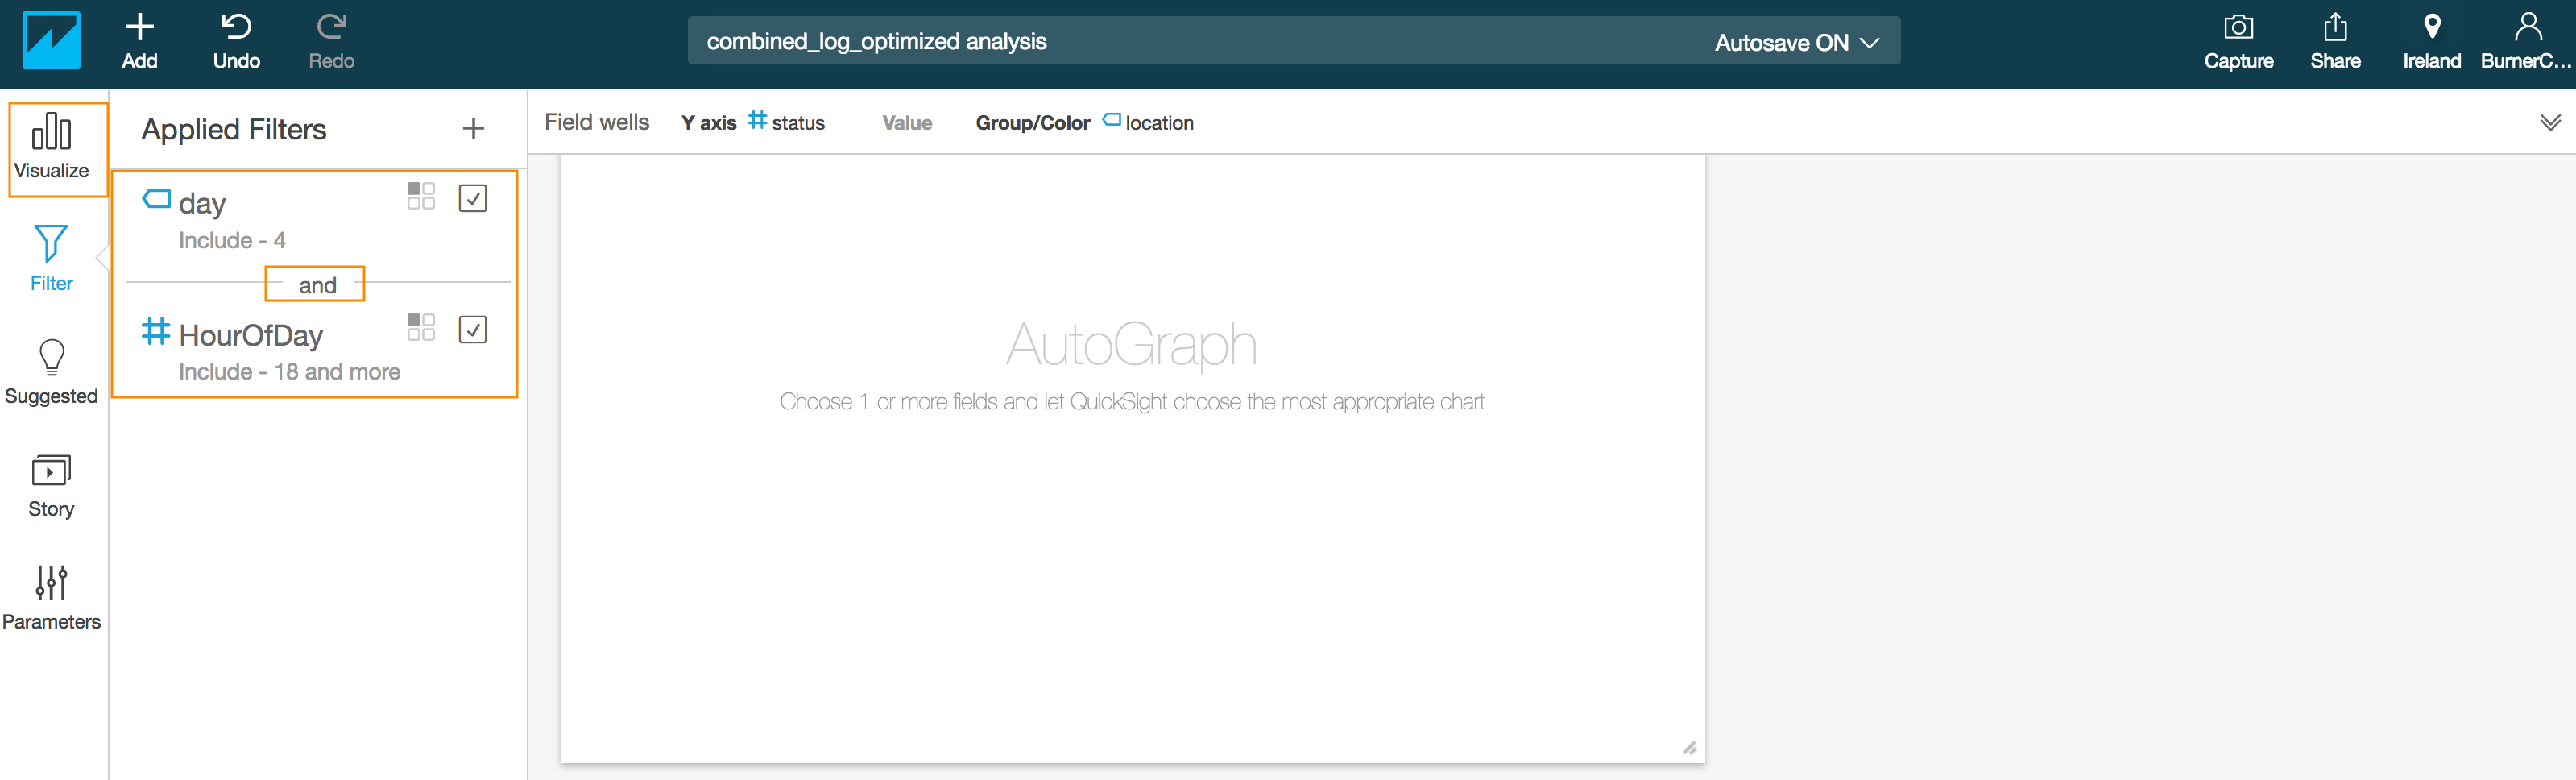
- Click again on **+** symbol next to **Applied Filters** to add another filter
- Select **HourOfDay** field in the pop up menu
- Choose the new filter that you just created by clicking on filter name **HourOfDay**
- Wait for QuickSight to load the filter values and then check the box next to one of the values for the day field *(e.g. 0)*
- Click **Apply**
- Click **Close**
- Click the **Visualize** icon in the QuickSight navigation pane
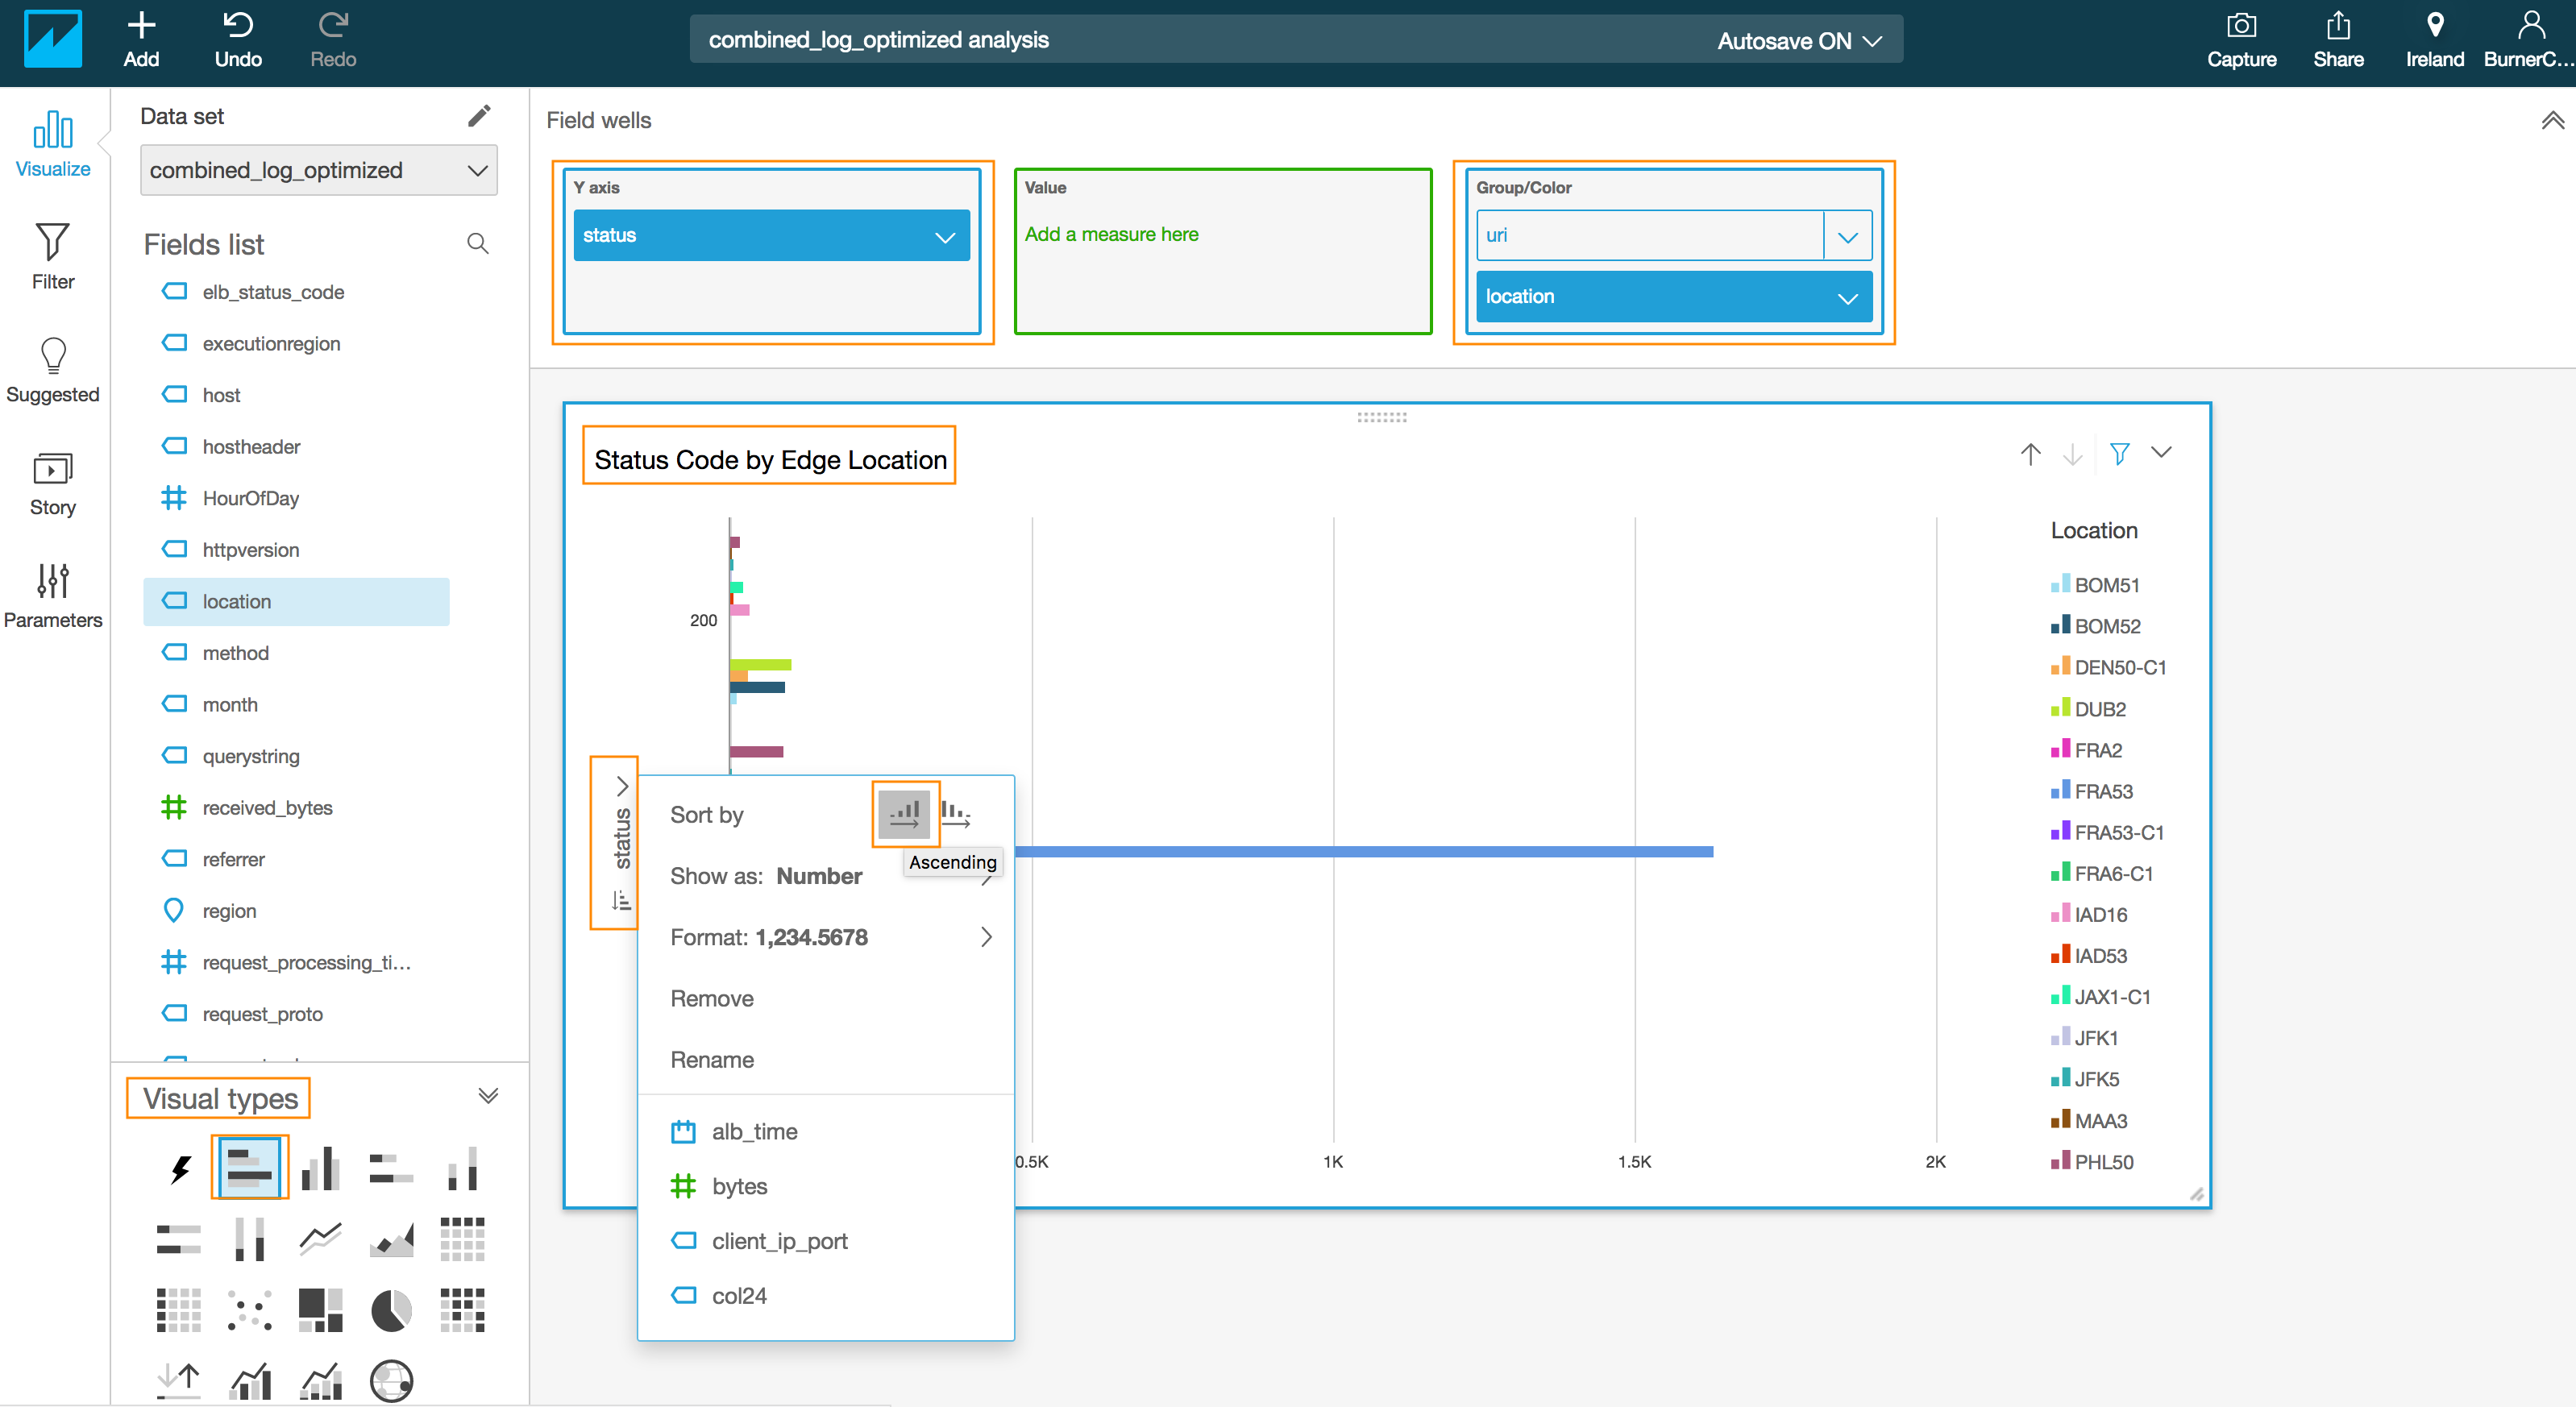
- Select the **Horizontal bar chart** under **Visual types**
- Drag and drop the **#status** field into the **Y axis** in the **Field wells** section on the top
- Drag and drop the **location** field into the **Group/Color** in the **Field wells** section
- Click on the drop down arrow next to **status** in the y-axis of the chart to reveal a sub menu.
- Click on the Ascending order for **Sort by** in the revealed menu
- Edit the title by click on the title in the chart to **Status code by Edge Location**(optional)
---
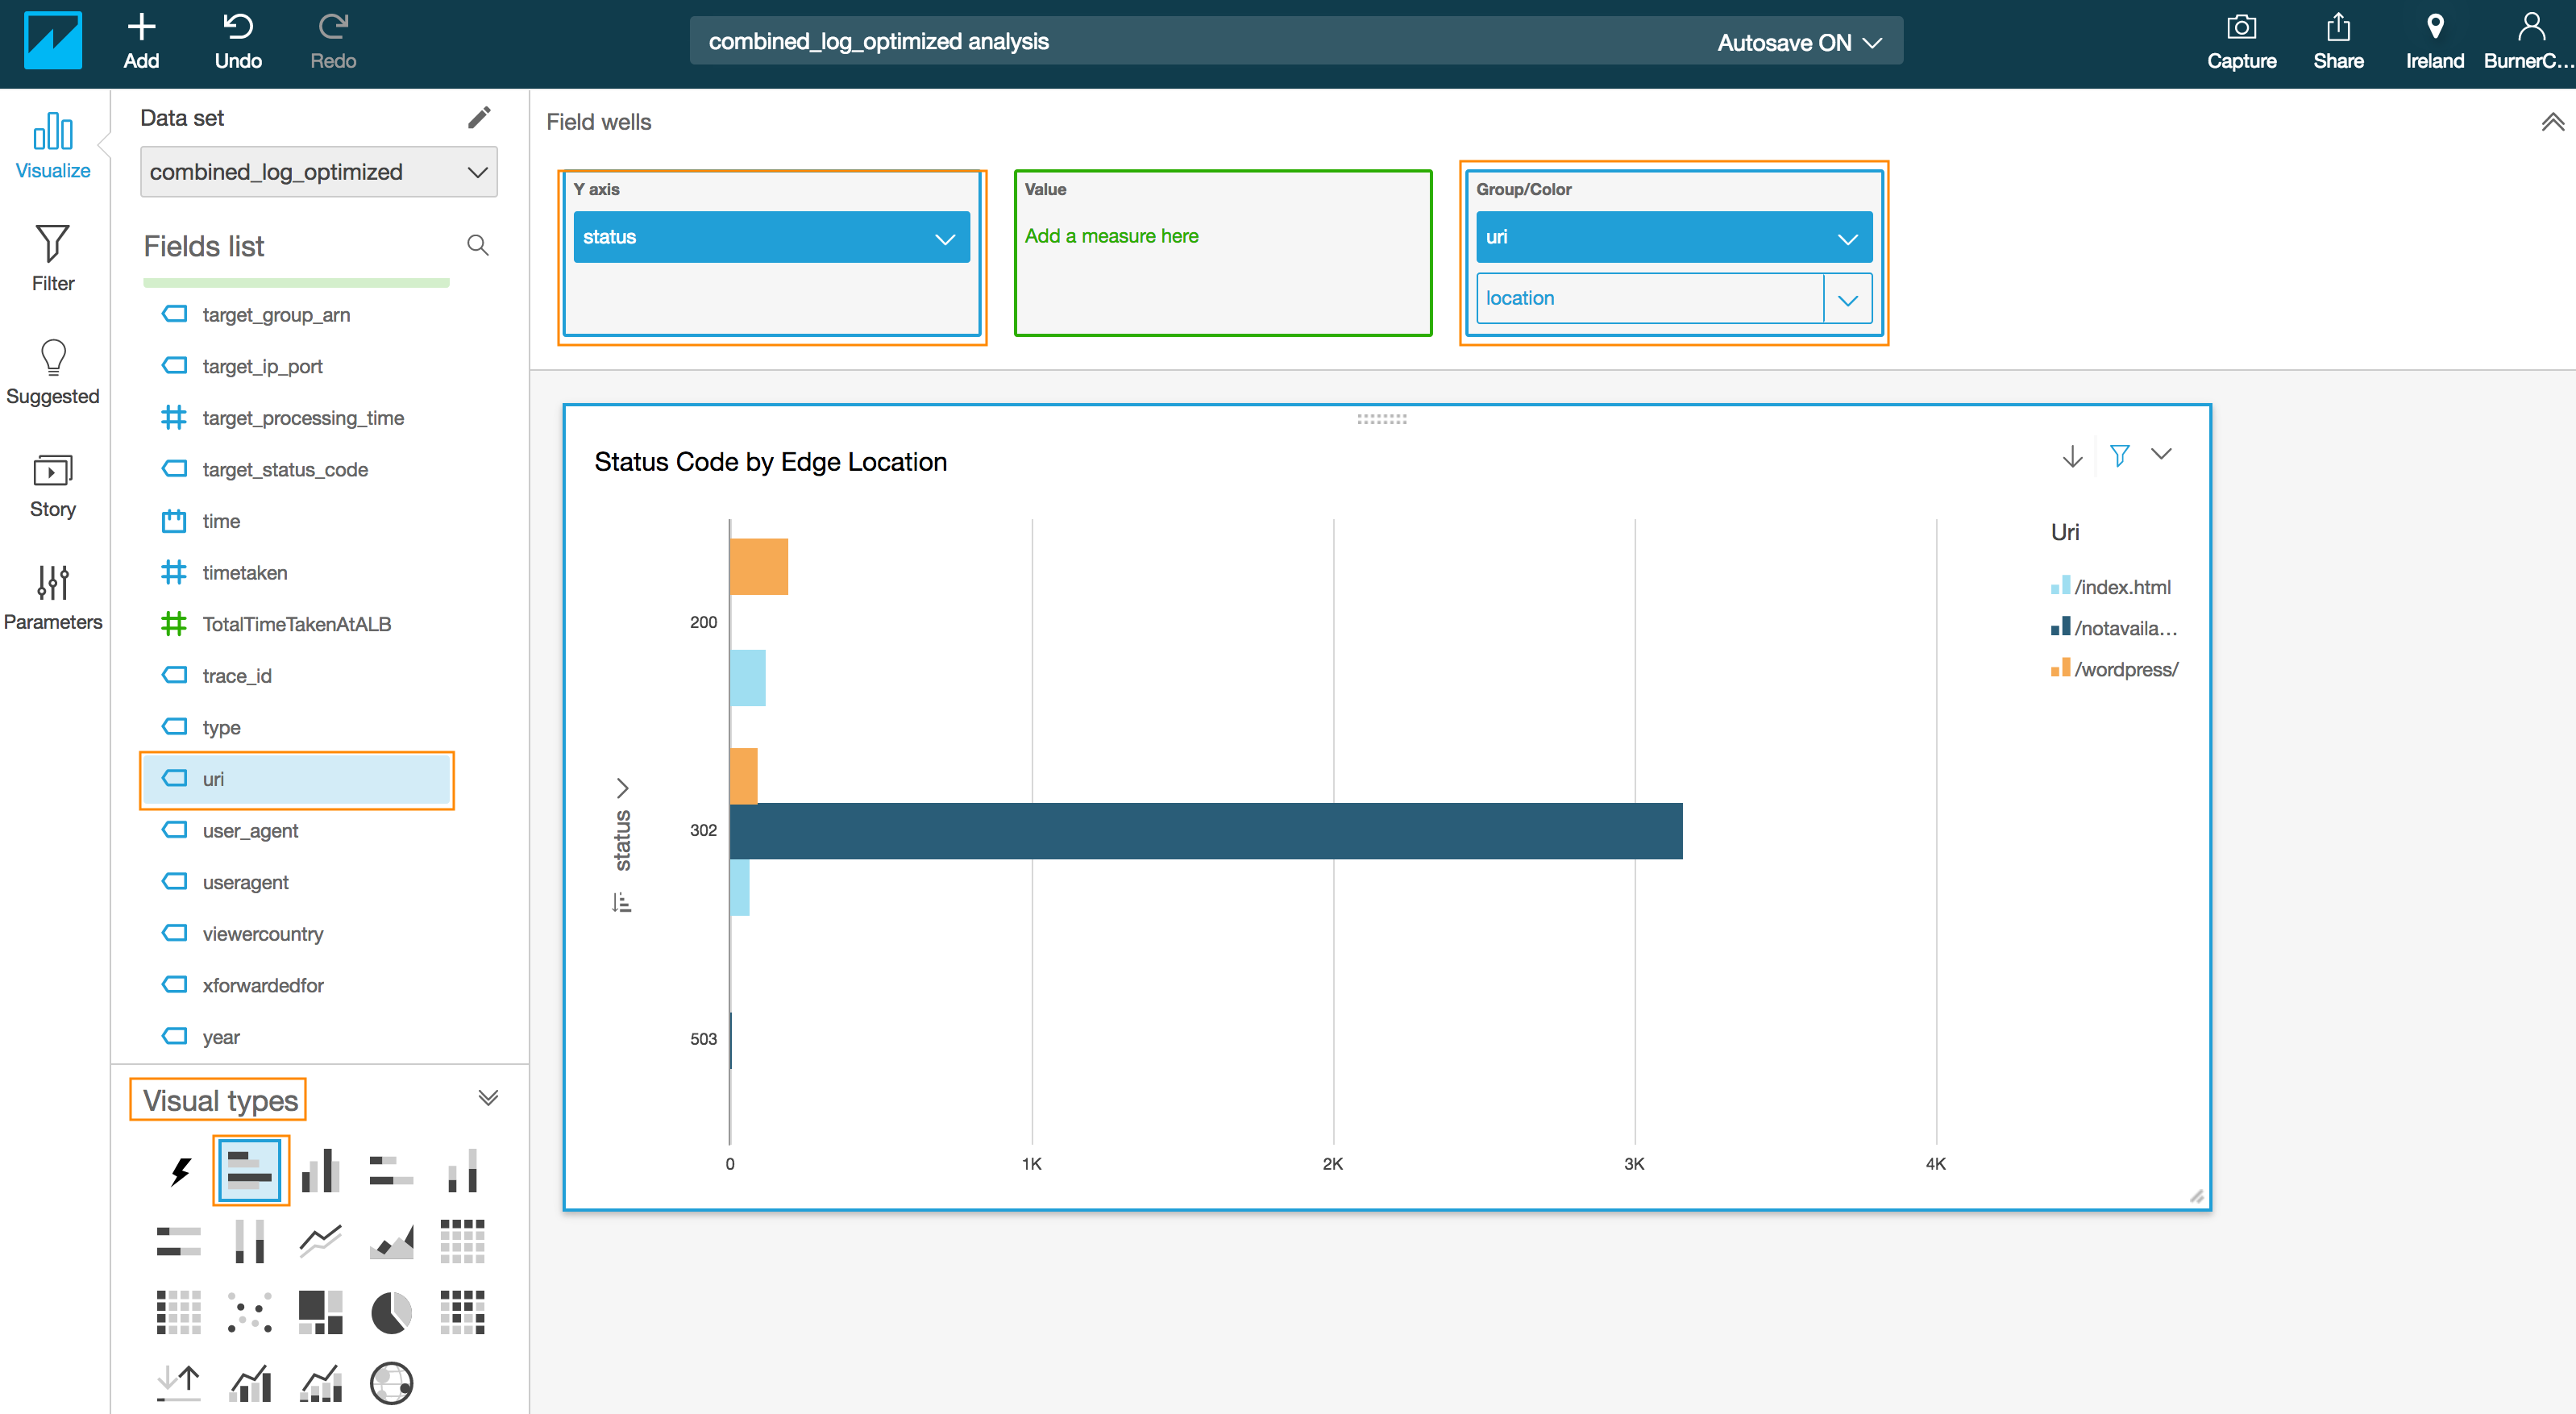
### (Optional) Generate visualization to status code count by request URI
CLICK TO EXPAND FOR OPTIONAL SECTION
**Use case:** HTTP Status Codes (3xx, 4xx, 5xx) error code by URI can provide insight into troubleshooting issue (such as 404- page not found etc.)
- Drag and drop the **uri** field into the **Group/Color** in the **Field wells** section.
> :warning: While dragging and and dropping multiple fields do not replace the existing field but drop the field on top
- Click on the drop down arrow next to **status** in the y-axis of the chart to reveal a sub menu.
- Click on the Ascending order for **Sort by** in the revealed menu
- Edit the title by click on the title in the chart to **Status code by URI**(optional)
---
### Generate visualization to show hourly average time taken between edge and origin by country where the end user request originated from
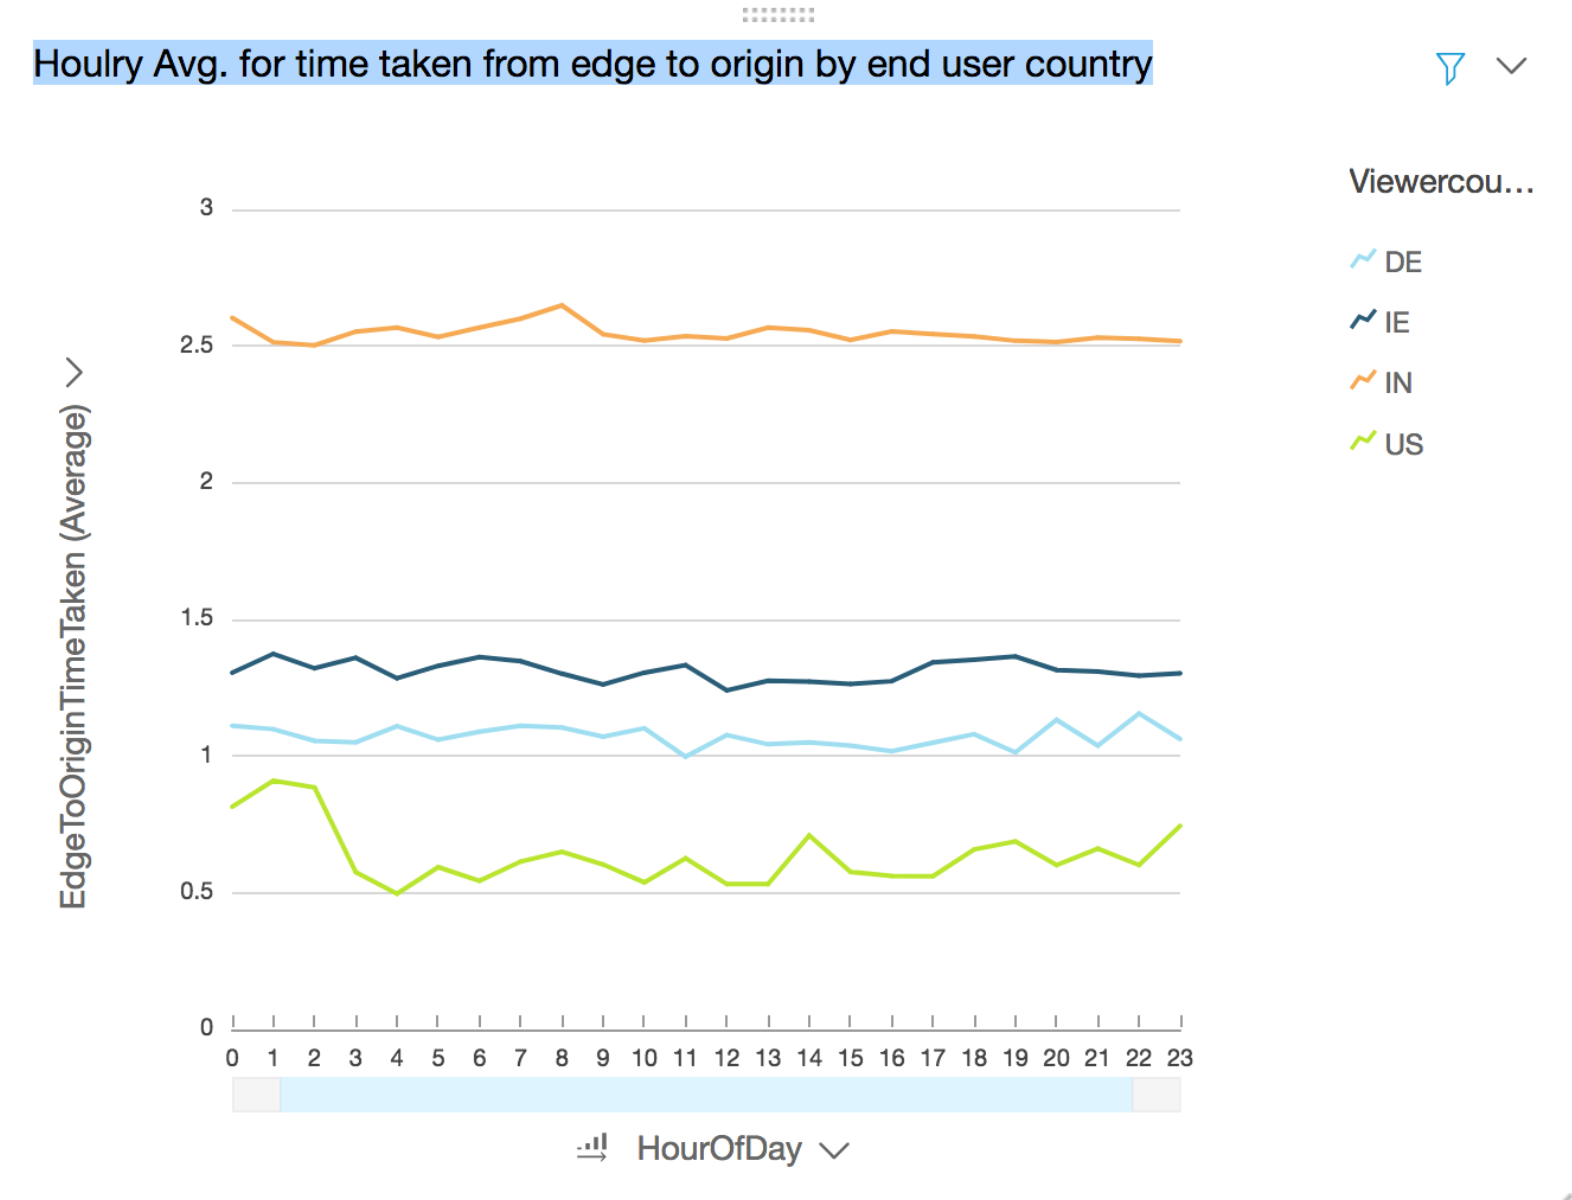
**Use case:** Derive insights into edge to origin latency for your global traffic and further optimize routing
- Ensure that the selected region is **Ireland** in top right corner
- Click on **Add** from the QuickSight menu on the top to **Add Visual** from the pop up menu
- Click the **Filter** icon in the QuickSight navigation pane
- Click on **+** symbol next to **Applied Filters**
- Select **day** field in the pop up menu
- Choose the new filter that you just created by clicking on filter name **day**
- Wait for QuickSight to load the filter values and then check the box next to one of the values for the day field *(e.g. 4)*
- Click **Apply**
- Click **Close**
- Click again on **+** symbol next to **Applied Filters** to add another filter
- Select **viewercountry** field in the pop up menu
- Choose the new filter that you just created by clicking on filter name **viewercountry**
- Select all the values **(DE, IE, IN, US)** except **NULL**
- Click **Apply**
- Click **Close**
- Click again on **+** symbol next to **Applied Filters** to add another filter
- Select **responseresulttype** field in the pop up menu
- Choose the new filter that you just created by clicking on filter name **responseresulttype**
- Select **Miss** from the list of values
- Click **Apply**
- Click **Close**
- Click the **Visualize** icon in the QuickSight navigation pane
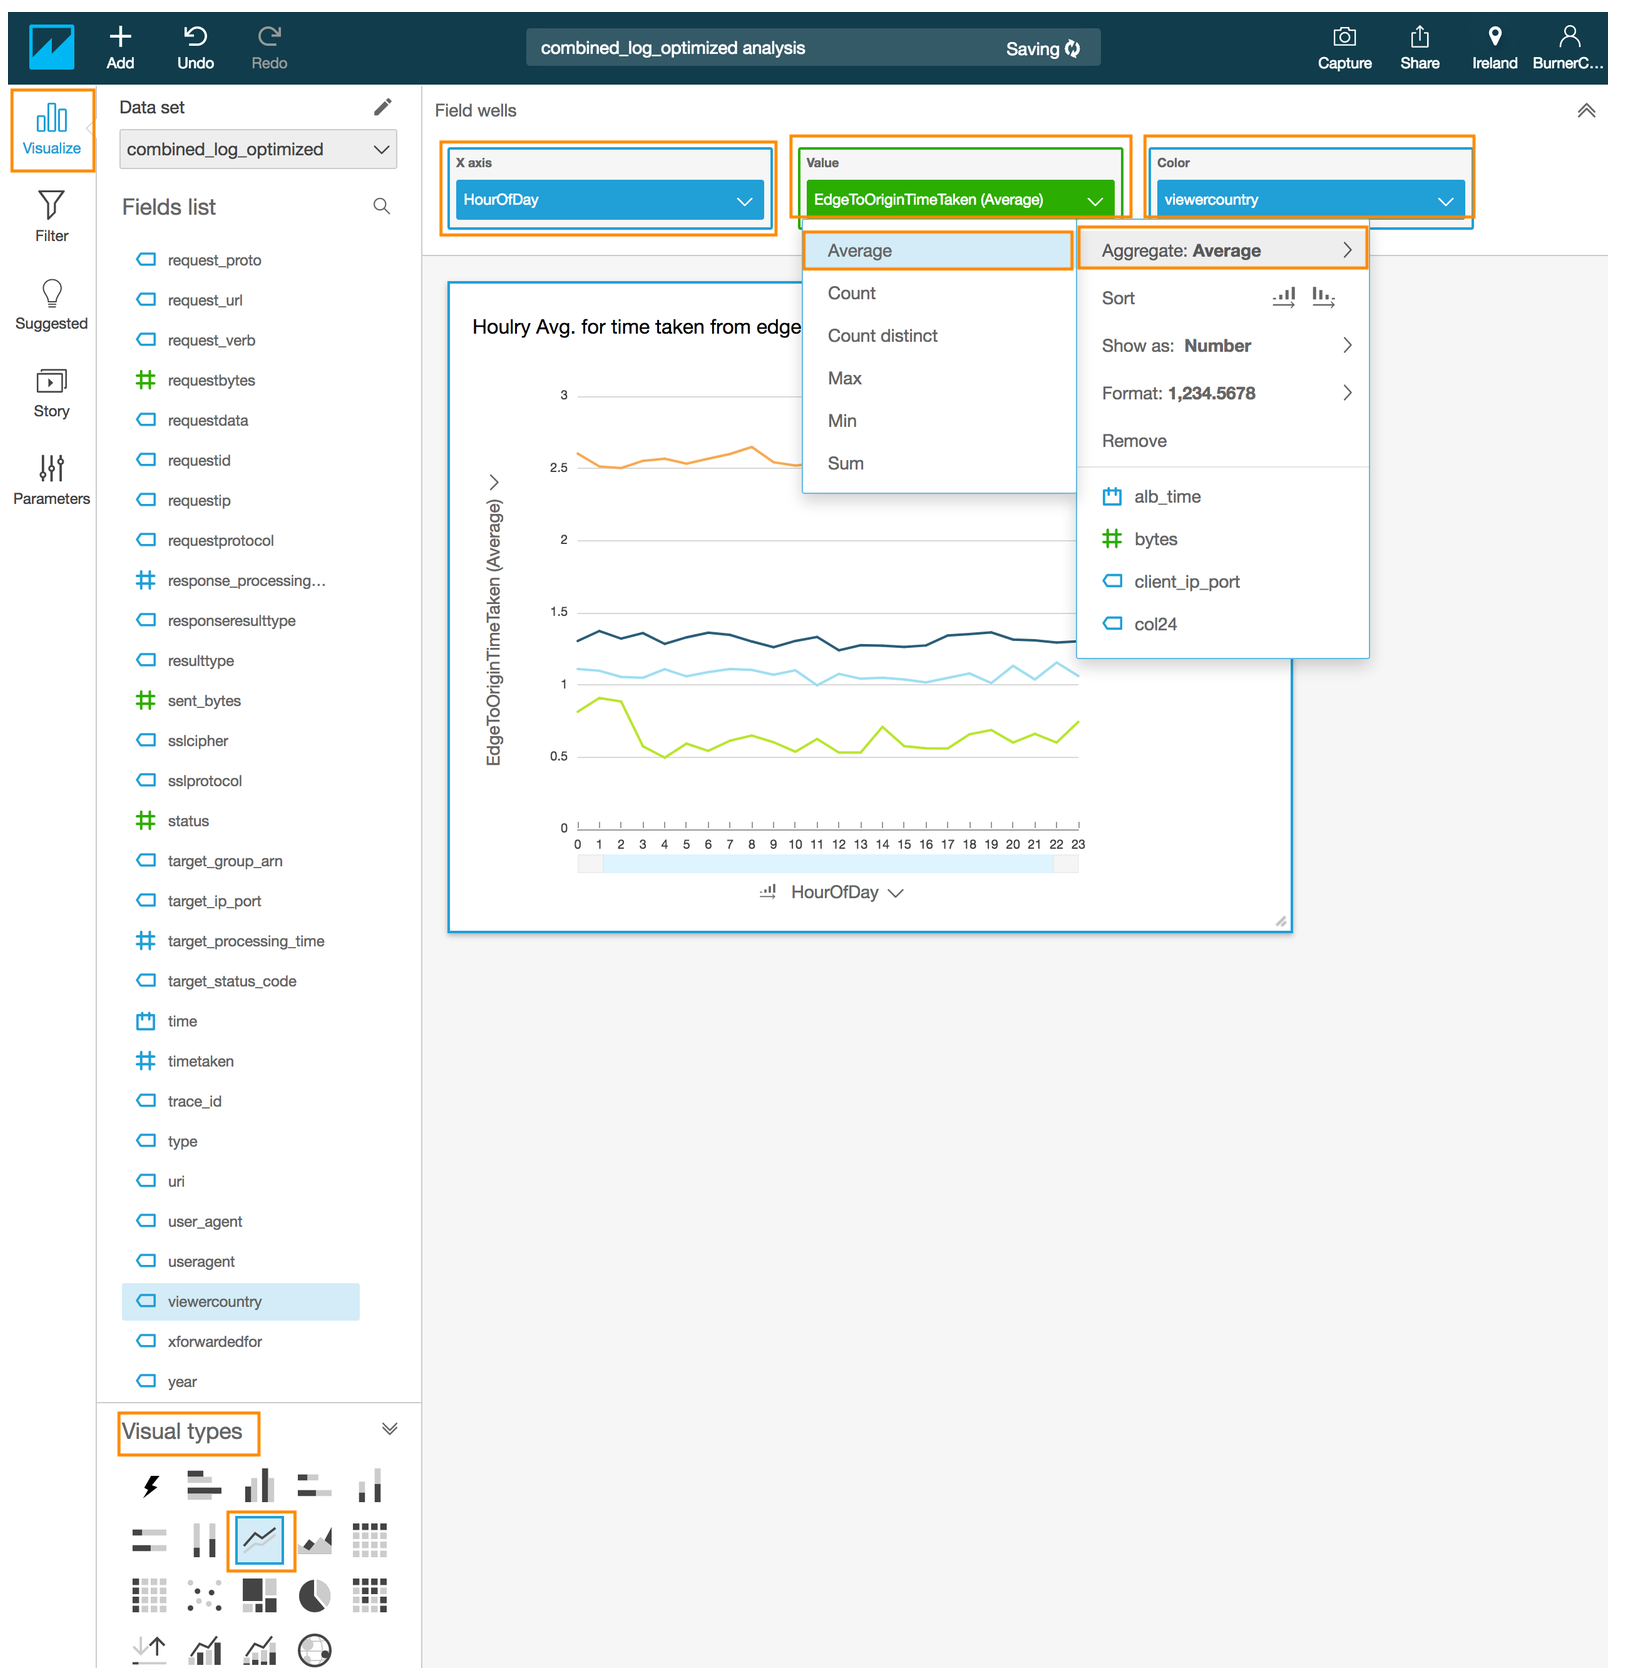
- Select the Line chart under **Visual types**
- Drag and drop the **#HourofDay** field into the **X axis** in the **Field wells** section on the top
- Drag and drop the **viewercountry** field into the **Color** in the **Field wells** section
- Drag and drop the **#EdgeToOriginTimeTaken** field into the **Value** in the **Field wells** section
- Click on the down arrow next to **EdgeToOriginTimeTaken** in the Value to reveal a sub-menu
- Select **Aggregate:** and select **Average**
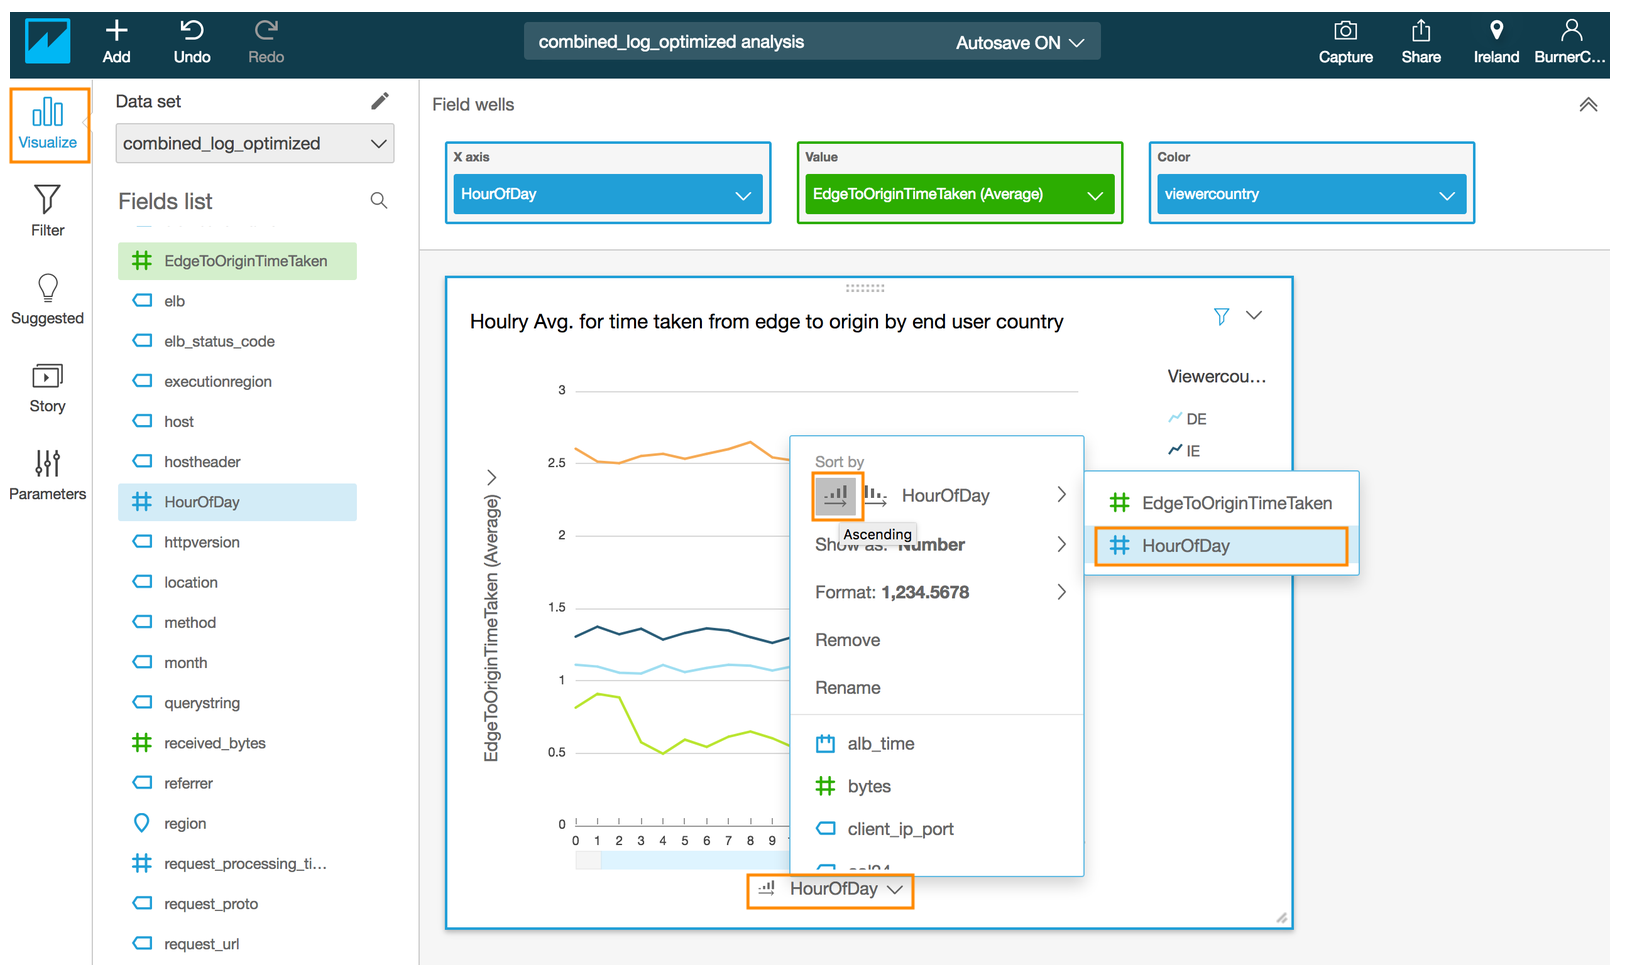
- Click on the drop down arrow next to **HourOfDay** in the x-axis of the chart to reveal a sub menu.
- Click on the Ascending order next to **HourOfDay** under **Sort by** in the revealed menu
- Edit the title by click on the title in the chart to **Hourly Avg. for time taken from edge to origin by end user country** (optional)
---
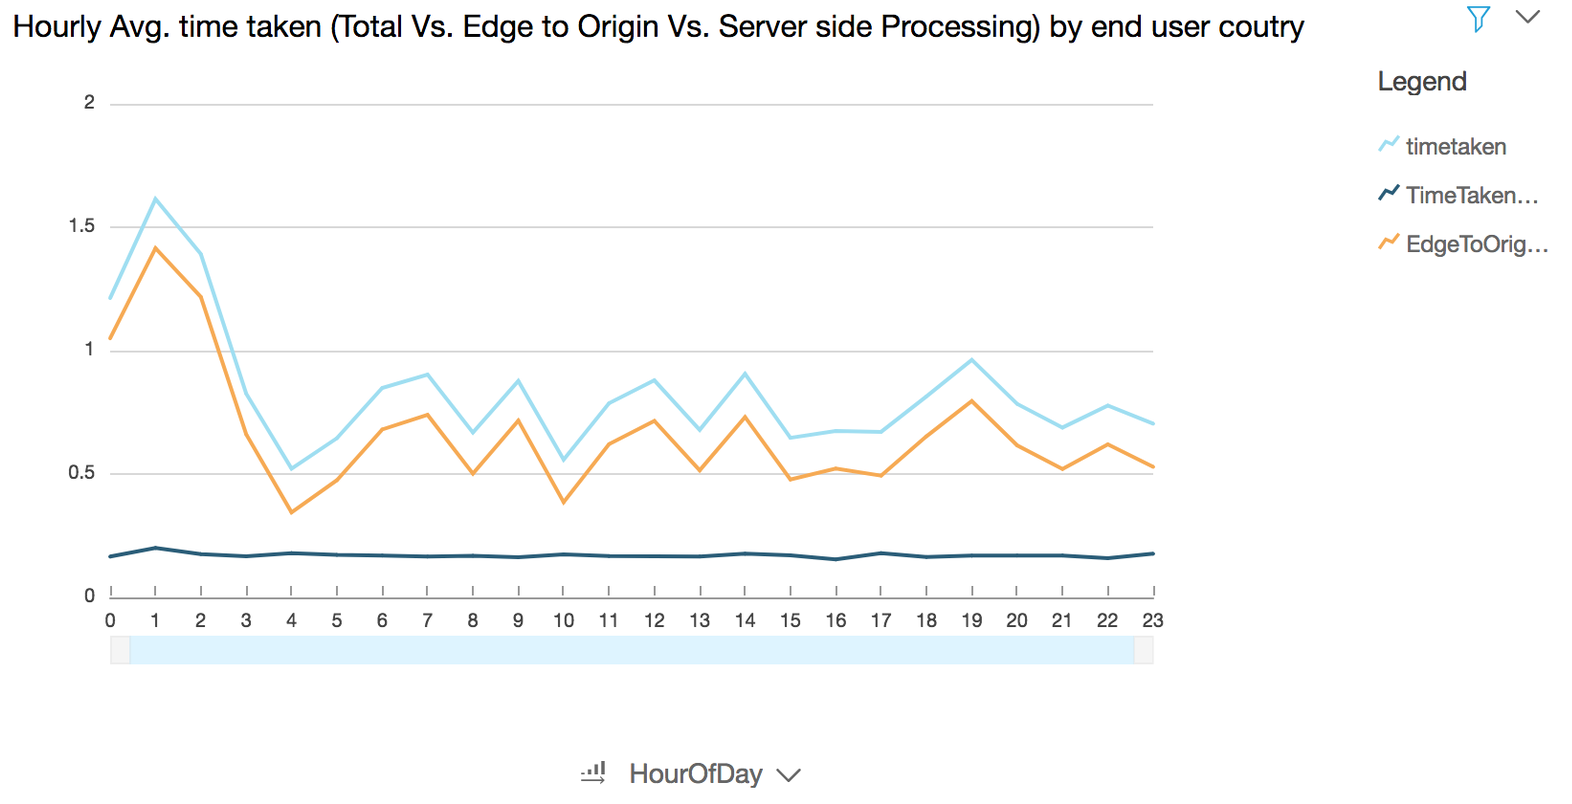
### Generate visualization to show hourly average time taken (total Vs. edge to origin Vs. server-side processing) by country where the end user request originated from
**Use case:** Troubleshoot latency issue at various stages of a request-response pipeline
- Click on **Add** from the QuickSight menu on the top to **Add Visual** from the pop up menu
- Ensure that the selected region is **Ireland** in top right corner
- Click the **Filter** icon in the QuickSight navigation pane
- Click on **+** symbol next to **Applied Filters**
- Select **day** field in the pop up menu
- Choose the new filter that you just created by clicking on filter name **day**
- Wait for QuickSight to load the filter values and then check the box next to one of the values for the day field (*e.g. 4 same day that you selected in the previous chart*)
- Click **Apply**
- Click **Close**
- Click again on **+** symbol next to **Applied Filters** to add another filter
- Select **viewercountry** field in the pop up menu
- Choose the new filter that you just created by clicking on filter name **viewercountry**
- Select one of the values (e.g. **US**) except **DE**
- Click **Apply**
- Click **Close**
- Click again on **+** symbol next to **Applied Filters** to add another filter
- Select **responseresulttype** field in the pop up menu
- Choose the new filter that you just created by clicking on filter name **responseresulttype**
- Select **Miss** from the list of values
- Click **Apply**
- Click **Close**
- Click the **Visualize** icon in the QuickSight navigation pane
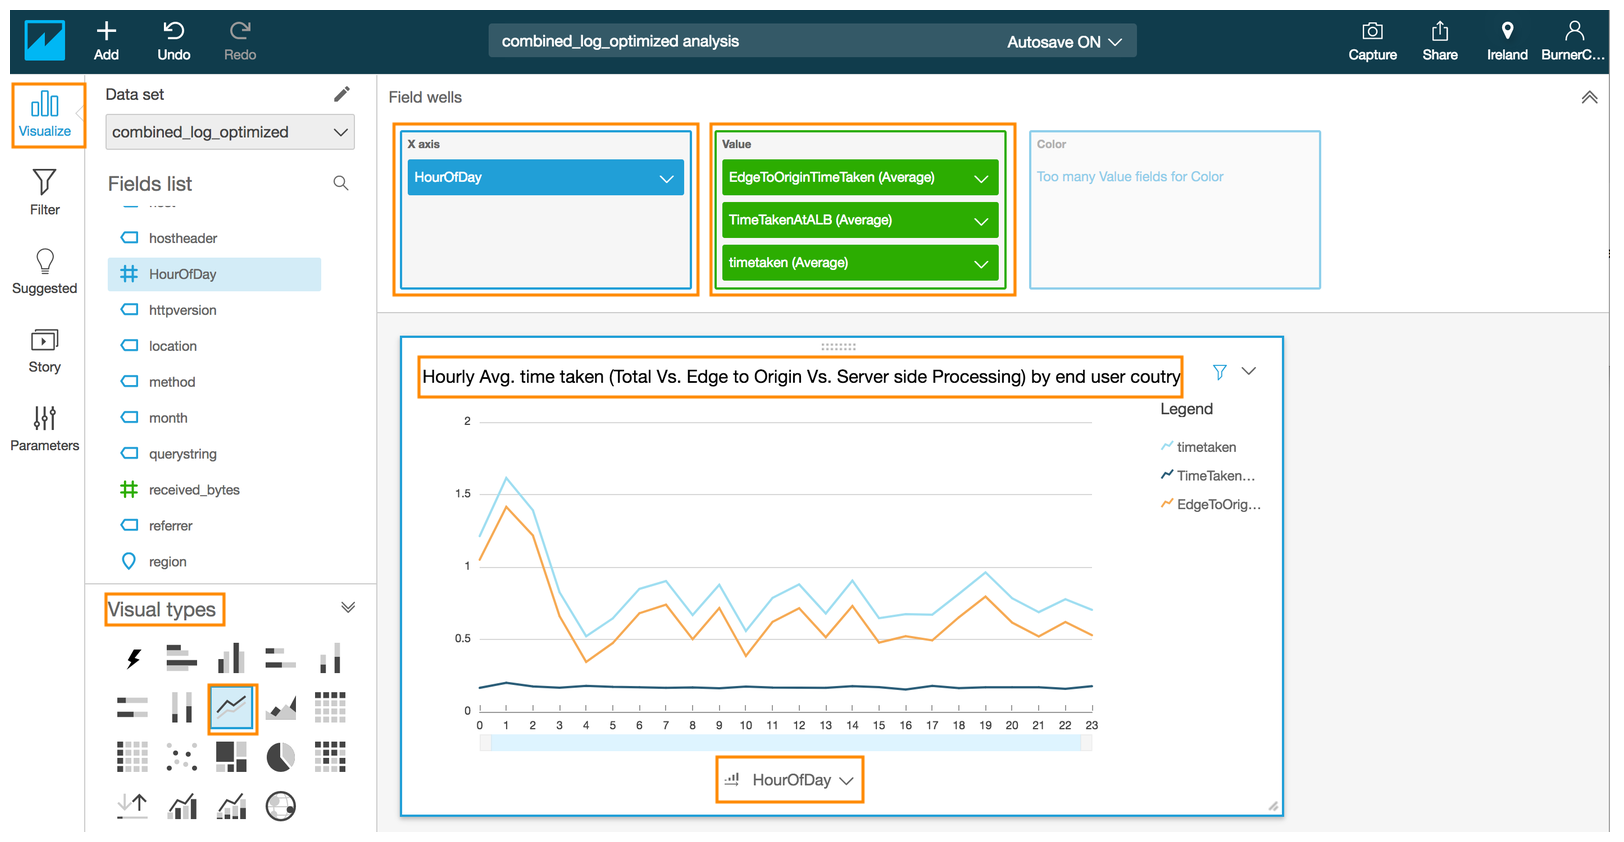
- Select the Line chart under **Visual types**
- Drag and drop the **#HourofDay**field into the **X axis** in the **Field wells** section on the top
- Drag and drop the **#EdgeToOriginTimeTaken** field into the **Value** in the **Field wells** section
- Click on the down arrow next to **EdgeToOriginTimeTaken** in the Value to reveal a sub-menu
- Select **Aggregate:** and select **Average**
- Drag and drop the **#TotalTimeTakenAtALB**field into the **Value** in the **Field wells** section
- Click on the down arrow next to **#TotalTimeTakenAtALB** in the Value to reveal a sub-menu
- Select **Aggregate:** and select **Average**
- Drag and drop the **#timetaken** field into the **Value** in the **Field wells** section
- Click on the down arrow next to **#timetaken** in the Value to reveal a sub-menu
- Select **Aggregate:** and select **Average**
- Click on the drop down arrow next to **HourOfDay** in the x-axis of the chart to reveal a sub menu.
- Click on the Ascending order next to **HourOfDay** under **Sort by** in the revealed menu
- Edit the title by click on the title in the chart to **Hourly Avg. time taken (total Vs. edge to origin Vs. server-side processing) by end user country** (optional)
---
### (Optional) Generate visualization to show hourly average time taken (total Vs. edge to origin V.s server-side processing) by country where the end user request originated from for a different viewer country
CLICK TO EXPAND FOR OPTIONAL SECTION
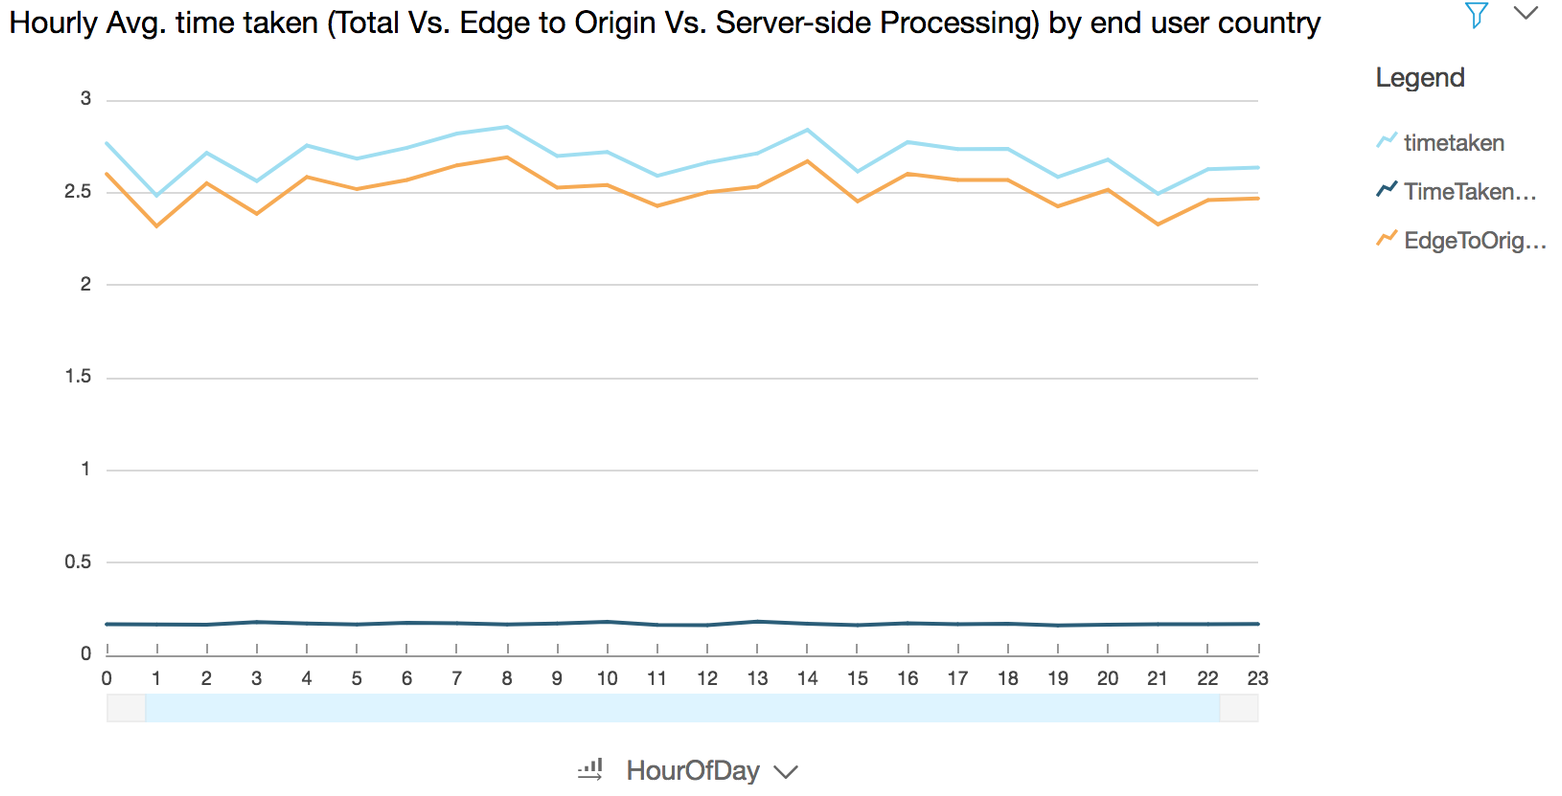
**Use case:** Troubleshoot latency issues at various stages of a request-response pipeline
- Click the **Filter** icon in the QuickSight navigation pane
- Choose the new filter that you just created by clicking on filter name **viewercountry**
- Select one of the values (e.g. **IN**) except **DE**
- Click **Apply**
- Click **Close**
- Click the **Visualize** icon in the QuickSight navigation pane
---
### Generate Visualization to show product category request by country
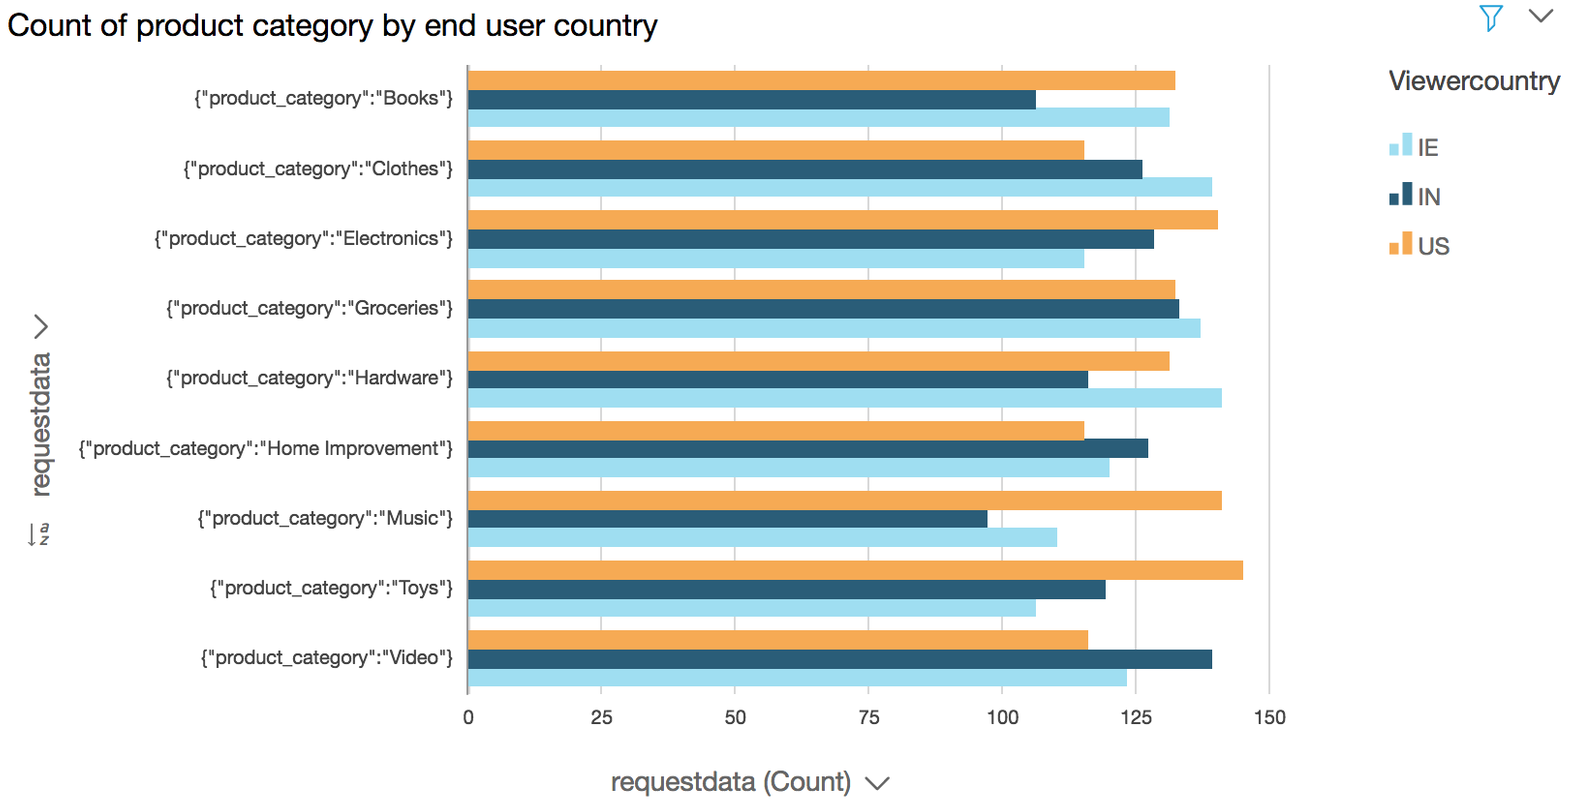
**Use case:** Based on the popular attributes (e.g. product categories) that your customers are requesting for you can prioritize and optimize latency by caching the pages for these popular categories or for delivering ad impression besides various other business insight your can derive in terms of inventory management etc.
- Click on **Add** from the QuickSight menu on the top to **Add Visual** from the pop up menu
- Ensure that the selected region is **Ireland** in top right corner
- Click the **Filter** icon in the QuickSight navigation pane
- Click again on **+** symbol next to **Applied Filters** to add another filter
- Select **requestdata** field in the pop up menu
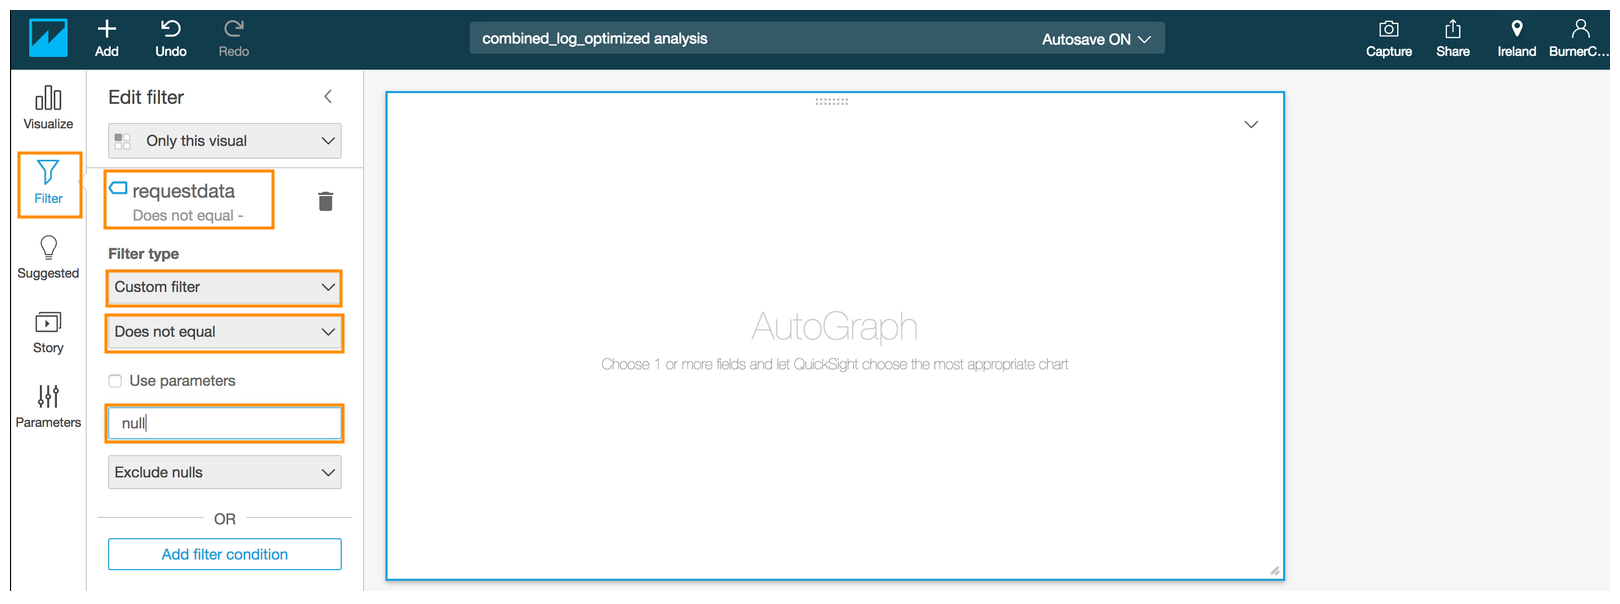
- Choose the new filter that you just created by clicking on filter name **requestdata**
- Choose **Custom filter** from the drop down for **Filter type**
- For the second drop down under **Filter type** choose **Does not equal**
- Type *null* in the text box.
- Click **Apply**
- Click **Close**
- Click again on **+** symbol next to **Applied Filters** to add another filter
- Select **viewercountry** field in the pop up menu
- Choose the new filter that you just created by clicking on filter name **viewercountry**
- Select all the values **(DE, IE, IN, US)** except **NULL**
- Click **Apply**
- Click **Close**
- Click the **Visualize** icon in the QuickSight navigation pane
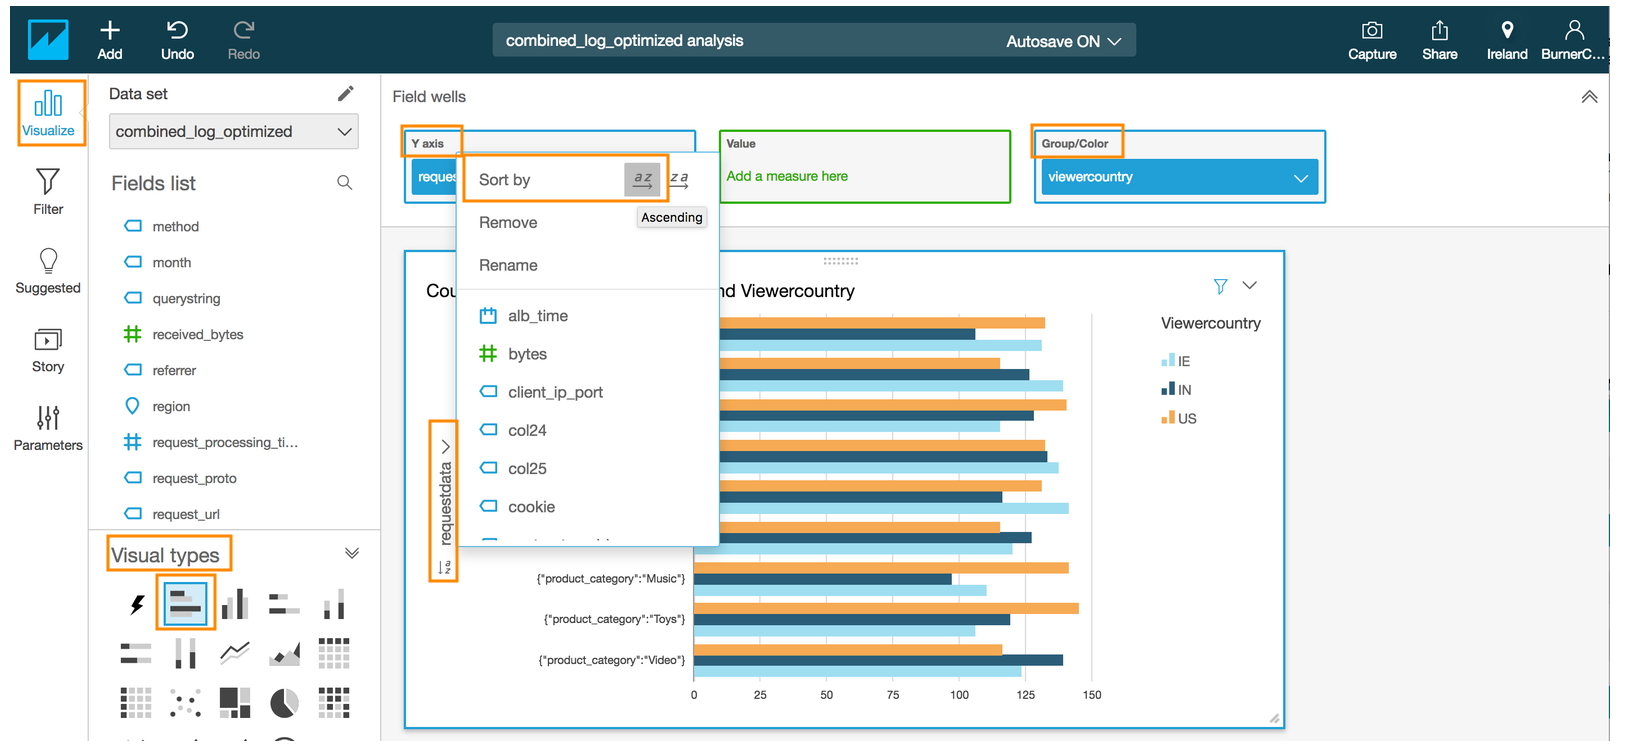
- Select the **Horizontal bar chart** under **Visual types**
- Drag and drop the **requestdata** field into the **Y axis** in the **Field wells** section on the top
- Drag and drop the **viewercountry** field into **Group/Color** in the **Field wells** section
- Click on the drop down arrow next to **requestdata** in the y-axis of the chart to reveal a sub menu.
- Click on the Ascending order for **Sort by** in the revealed menu
- Edit the title by click on the title in the chart to **Count of product category by end user country**(optional)
---
### (Optional) Generate visualization to show device form factor ratio
CLICK TO EXPAND FOR OPTIONAL SECTION
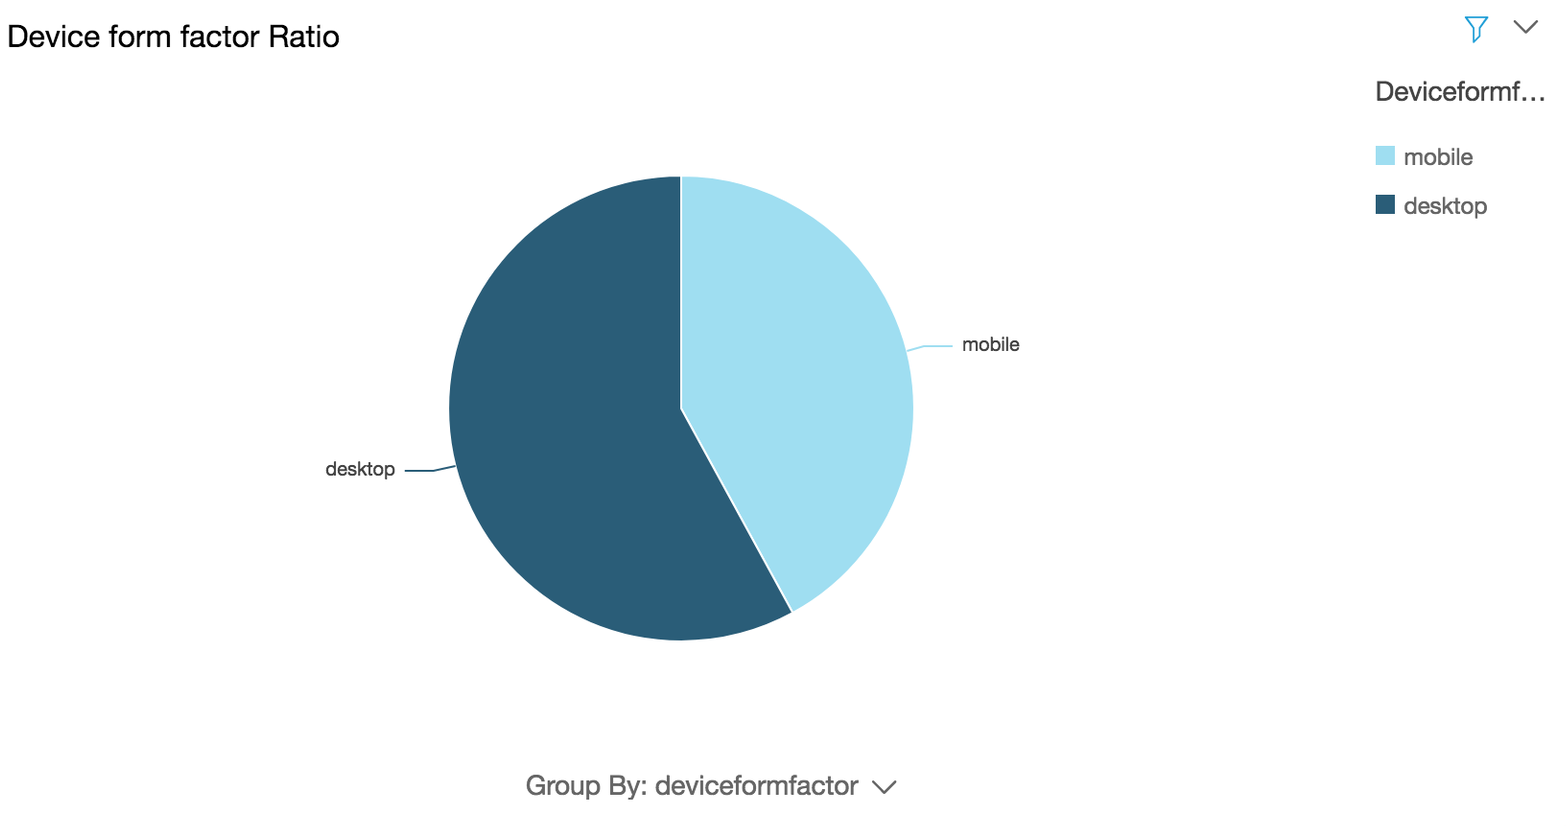
**Use case:** Based on the popular device form factor(s) that your global customers are using to browse your website you can prioritize customization and optimization of your content on those form factor(s)
- Click on **Add** from the QuickSight menu on the top to **Add Visual** from the pop up menu
- Ensure that the selected region is **Ireland** in top right corner
- Click the **Filter** icon in the QuickSight navigation pane
- Click on **+** symbol next to **Applied Filters**
- Select **deviceformfactor** field in the pop up menu
- Choose the new filter that you just created by clicking on filter name **deviceformfactor**
- Choose **Custom filter** from the drop down for **Filter type**
- For the second drop down under **Filter type** choose **Does not equal**
- Type *null* in the text box.
- Click **Apply**
- Click **Close**
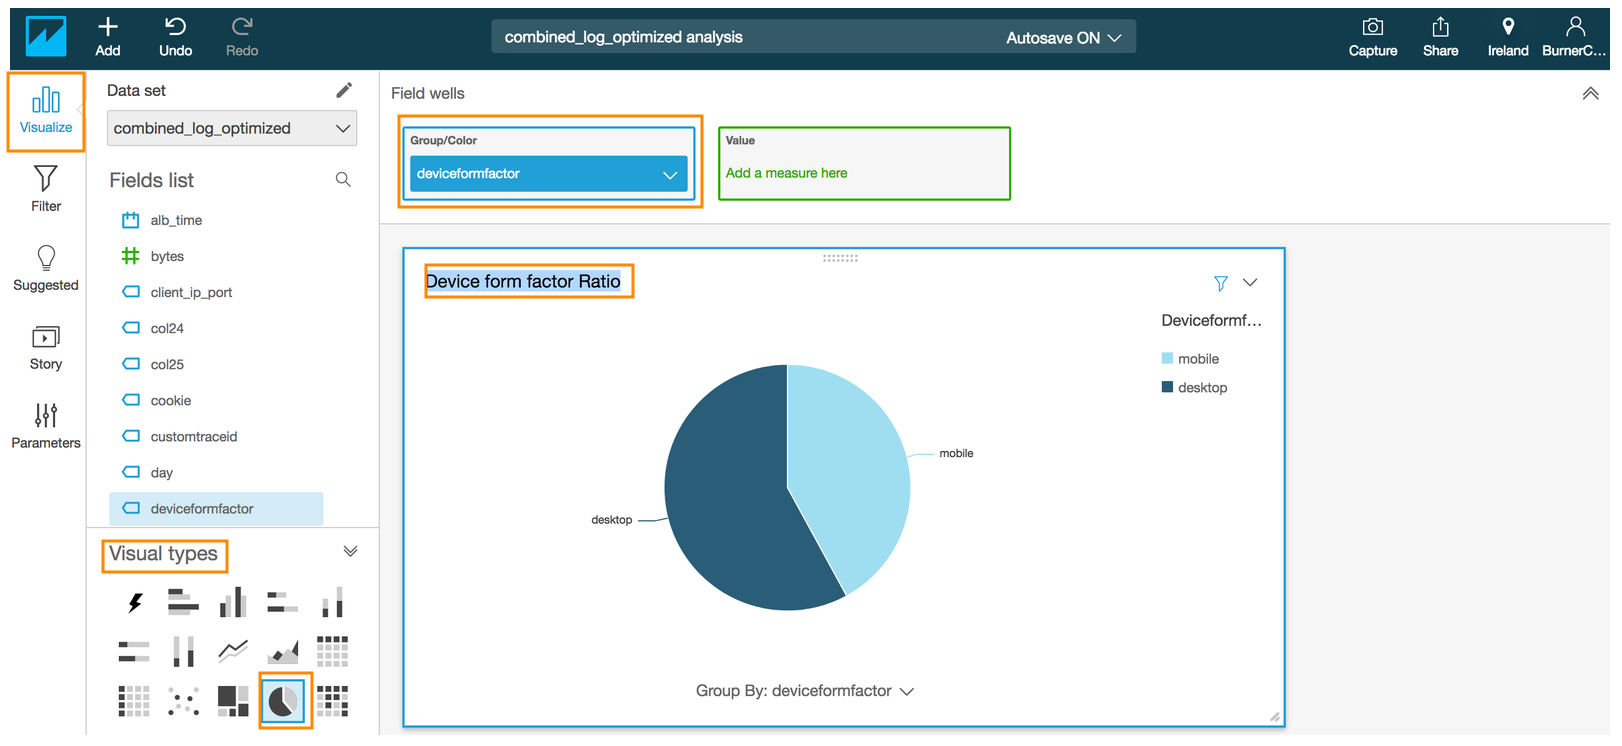
- Click the **Visualize** icon in the QuickSight navigation pane
- Select the **Pie chart** under **Visual types**
- Drag and drop the **deviceformfactor** field into **Group/Color** in the **Field wells** section
- Edit the title by click on the title in the chart to **Device form factor Ratio** (optional)
---
### (Optional) Generate visualization to show device form factor ration by viewer country
CLICK TO EXPAND FOR OPTIONAL SECTION
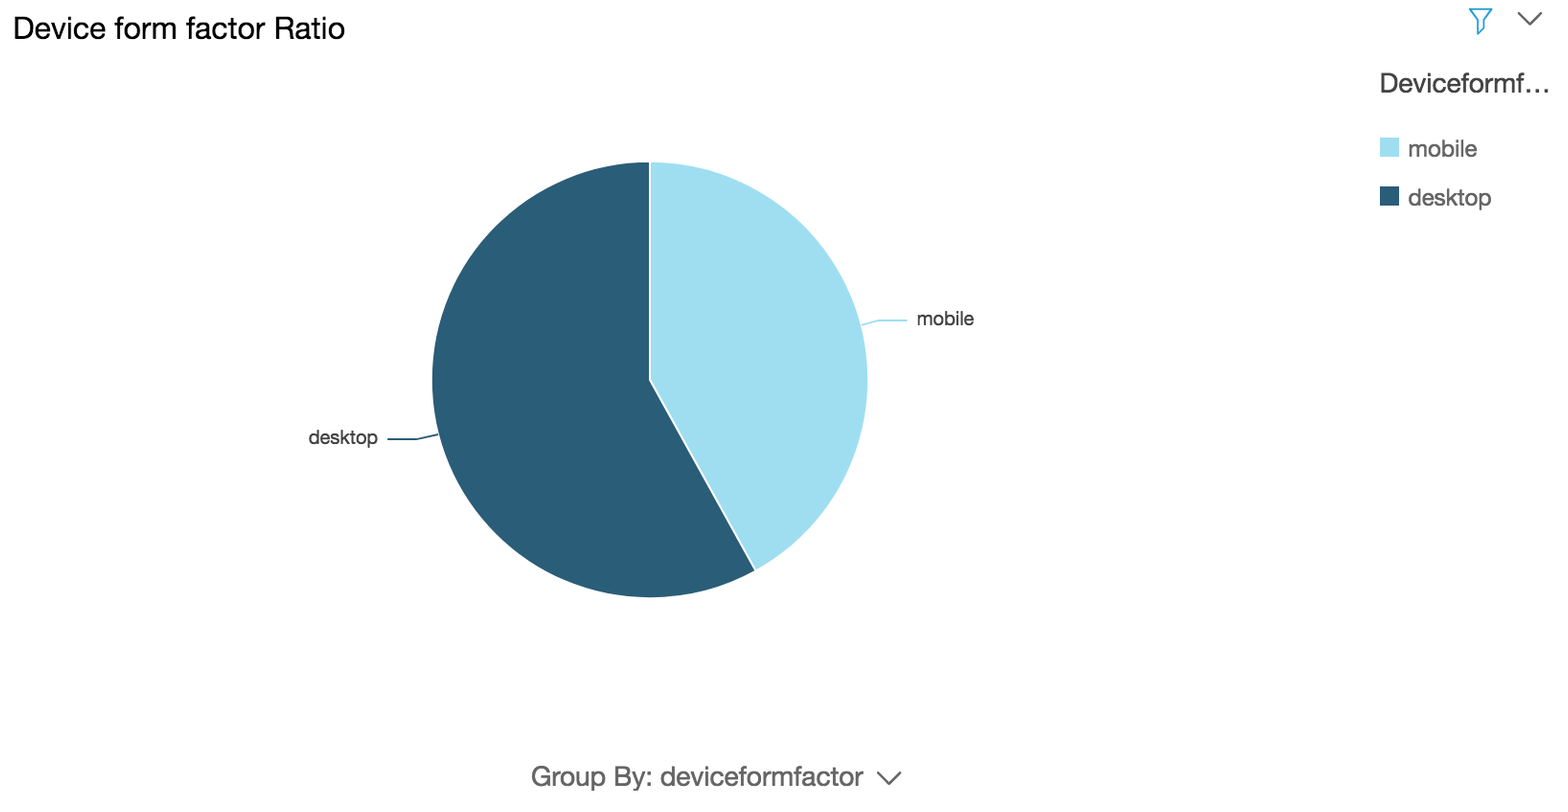
**Use case:** Based on the popular device form factor(s) that customers in a particular region or country are using to browse your website you can prioritize customization and optimization of your content on those form factor(s)
- Click the **Filter** icon in the QuickSight navigation pane
- Click on **+** symbol next to Applied Filters
- Choose the new filter that you just created by clicking on filter name **viewercountry**
- Select one of the values (e.g. **IN**) except **DE**
- Click **Apply**
- Click **Close**
- Click the **Visualize** icon in the QuickSight navigation pane
---
---
## License Summary
This sample code is made available under a modified MIT license. See the LICENSE file.