### Creating an ETL Lambda function 1. In the AWS Management Console select **Services** then select **Lambda** under Compute. 1. In the service console, select **Create a function** 1. In **Create function page**, select **Author from scratch**. Give your function a name such as `apache_ETL`. 1. For **Runtime**, select **Python 2.7**. 1. Under **IAM Role**, select **Create a custom role** to bring up a new IAM role creation page. 1. Under IAM Role, use the drop down menu to select **Create a new IAM Role**, then enter a name such as `lambda_basic_execution_apache_ETL` . This will automatically generate the permissions required for our Lambda to run and write logs to CloudWatch. 1. Proceed to the next step by selecting **Allow**. 1. Back in create function page, proceed by selecting **Create function** at the bottom of the page. 1. Scroll down to the Code editing window and you'll see some sample code like below. ``` python import json def lambda_handler(event, context): # TODO implement return { "statusCode": 200, "body": json.dumps('Hello from Lambda!') } ``` 1. Delete and replace the sample code with the following script. Have a look at the code and the comments to see what's happening to the incoming data before it is ETL'ed and put back into the Firehose stream. ``` python from __future__ import print_function import base64 import json import re from dateutil.parser import parse from datetime import datetime, tzinfo, timedelta print('Loading function') class UTC(tzinfo): """UTC""" def utcoffset(self, dt): return timedelta(0) def tzname(self, dt): return "UTC" def dst(self, dt): return timedelta(0) utc = UTC() def lambda_handler(event, context): print ("This is the raw event: {}".format(event)) output = [] succeeded_record_cnt = 0 failed_record_cnt = 0 safe_string_to_int = lambda x: int(x) if x.isdigit() else x ## Because data in Kinesis is base64 encoded, we have to decode it before changing the output as a JSON document for record in event['records']: print(record['recordId']) payload = base64.b64decode(record['data']) payload = payload.decode("utf-8") print ("This is the payload: {}".format(payload)) # check if clickstream log format else fall back to other log format regex = '^([\d.]+) (\S+) (\S+) \[([\w:\/]+)(\s[\+\-]\d{4}){0,1}\] "(.+?)" (\d{3}) (\d+) (".+?") (".+?") "user = ([^;]*)' p = re.compile(regex) m = p.match(payload) if p.match(payload) is None: # log format doesnt have cookie data (username) regex = '^([\d.]+) (\S+) (\S+) \[([\w:/]+)(\s[\+\-]\d{4}){0,1}\] \"(.+?)\" (\d{3}) (\d+) (".+?") (".+?")' p = re.compile(regex) m = p.match(payload) if m: succeeded_record_cnt += 1 ts = m.group(4) ## changing the timestamp format try: d = parse(ts.replace(':', ' ', 1)) ts = d.isoformat() except: print('Parsing the timestamp to date failed.') ## Creating our dictionary (hash map) using extracted values from our log file data_field = { 'host': m.group(1), 'ident': m.group(2), 'authuser': m.group(3), '@timestamp': ts, 'request': m.group(6), 'response': safe_string_to_int(m.group(7)), 'bytes': safe_string_to_int(m.group(8)), 'referer': safe_string_to_int(m.group(9)), 'user-agent': safe_string_to_int(m.group(10)) } ## Clickstream log, adding username from cookie field if (len(m.groups()) > 10): data_field['username'] = safe_string_to_int(m.group(11)) if m.group(6) and len(m.group(6).split()) > 1: data_field['verb'] = m.group(6).split()[0] # If time offset is present, add the timezone and @timestamp_utc fields if m.group(5): data_field['timezone'] = m.group(5).strip() try: ts_with_offset = m.group(4) + m.group(5) d = parse(ts_with_offset.replace(':', ' ', 1)) utc_d = d.astimezone(utc) data_field['@timestamp_utc'] = utc_d.isoformat() except: print('Calculating UTC time failed.') output_record = { 'recordId': record['recordId'], 'result': 'Ok', 'data': base64.b64encode(json.dumps(data_field)) } else: print('Parsing failed') failed_record_cnt += 1 output_record = { 'recordId': record['recordId'], 'result': 'ProcessingFailed', 'data': record['data'] } output.append(output_record) ## This returns the transformed data back to Kinesis Data Firehose for delivery to our Elasticsearch domain print('Processing completed. Successful records {}, Failed records {}.'.format(succeeded_record_cnt, failed_record_cnt)) print ("This is the output: {}".format(output)) return {'records': output} ``` 1. After putting our new code in, scroll down and find a section called **Basic settings**. Increase the timeout from 3 seconds to 1 min to allow our lambda function to process the record transformation, reducing the risk of timing out before it is complete. 1. Finish creating the function by selecting **Save** at the top of the page.
1. In the AWS Management Console select **Services** then select **Kinesis** under Analytics. 1. In the service console, select **Get started** and select **Create delivery stream** for the Kinesis Firehose wizard. 1. Under **New delivery stream**, give your Delivery stream name such as `webserver_stream`. 1. Under **Choose source**, verify that **Direct PUT or other sources** is selected. Although Kinesis Data Firehose can be configured to ingest data from a Kinesis Data stream (non-firehose), we will be using an agent to push into our Firehose stream. 1. Proceed to the next page by selecting **Next**. 1. In Step 2: Process records, enable **Record transformation** using the Lambda function we created previously (eg. apache_ETL). 1. Verify that Record format conversion is **Disabled** under **Convert record format**. If we wanted to deliver the data within Firehose for running analytics within Redshift or S3 (via Athena), this would be a great way to automatically transform the data into a columnar format such as Parquet for a more efficient file format for analytics. 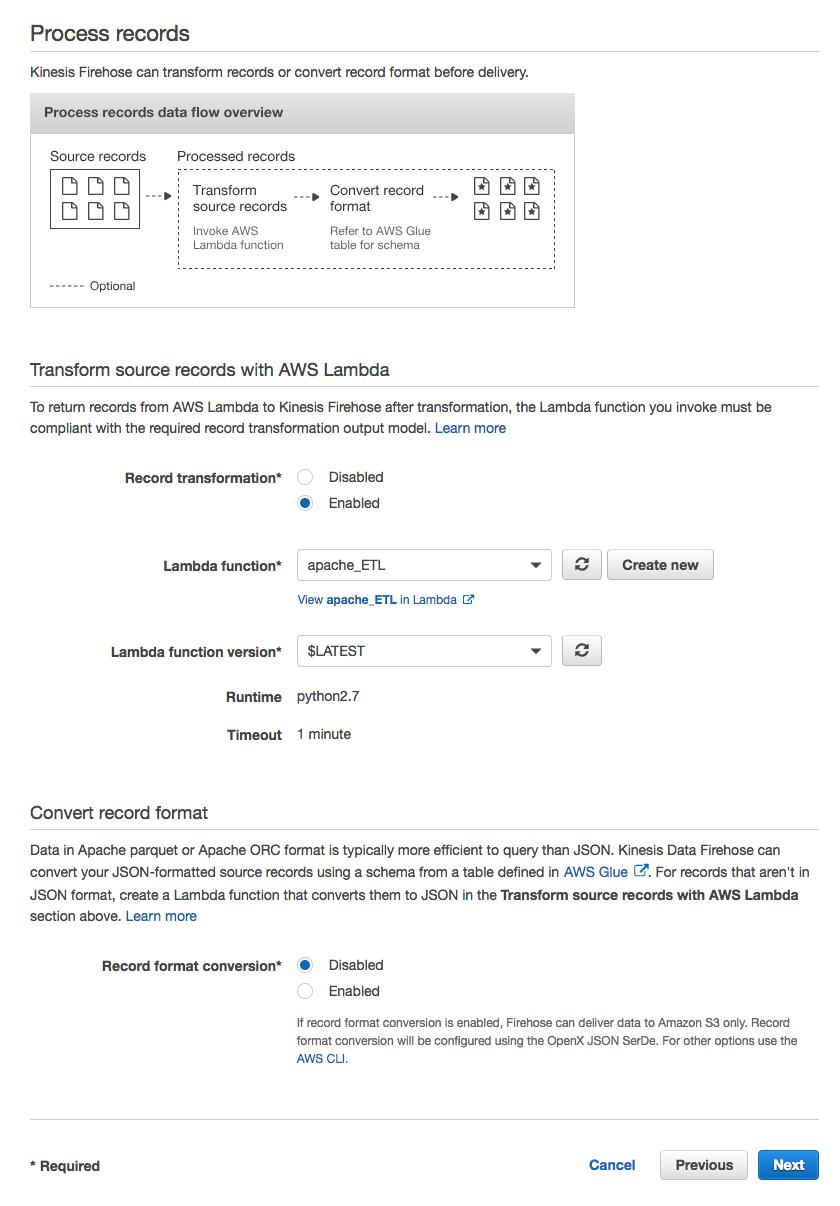 1. Proceed to the next page by selecting **Next**. 1. Under **Select destination**, select **Amazon Elasticsearch Service** to view our existing domain. 1. Under **Amazon Elasticsearch Service destination**, select our existing cluster for **Domain**. 1. For **Index**, enter a name such as `apache`. 1. Select **No rotation** for index rotation frequency and enter a name for **Type** such as `clickstream`. 1. Under **S3 backup**, we can select whether a copy of the records from our Firehose is automatically backed up into an S3 bucket, or only for records that fails to be processed. For this workshop, select **All records** to view the data later on to have a look at the ingested data. 1. Create or use an existing S3 bucket and for **Backup S3 bucket prefix**, enter a name followed by underscore such as `apache_`. This will make it easier later on to identify which prefix our firehose backups the records into. 1. Your settings should look similar to this 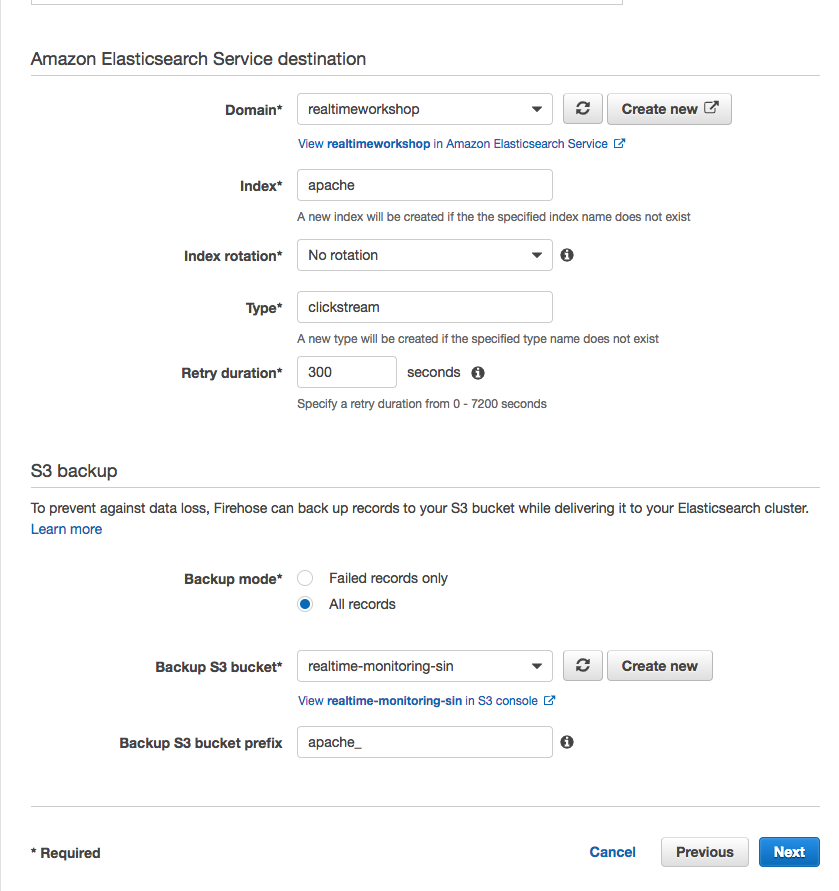 1. Proceed to the next page by selecting **Next**. 1. In Step 4: Configure Settings, select a **Buffer size** of 1 MB and **Buffer interval** of 60 seconds. As Firehose automatically buffers and aggregates the data in the stream, it will wait until either of these conditions are met before triggering the delivery. If you need to ensure faster (lower) availability of data in the stream, Kinesis Data Stream allows a more immediate window. 1. For **S3 compression and encryption** check that the settings are set to **Disabled**, and for **Error logging**, ensure that it is **Enabled** for future troubleshooting if required. 1. Under IAM Role, use the drop down menu to select **Create a new IAM Role**, then enter a name such as `firehose_delivery_role_clickstream` . This will automatically generate the permissions required for our Firehose to use the configured settings for CloudWatch, S3, Lambda and ElasticSearch. 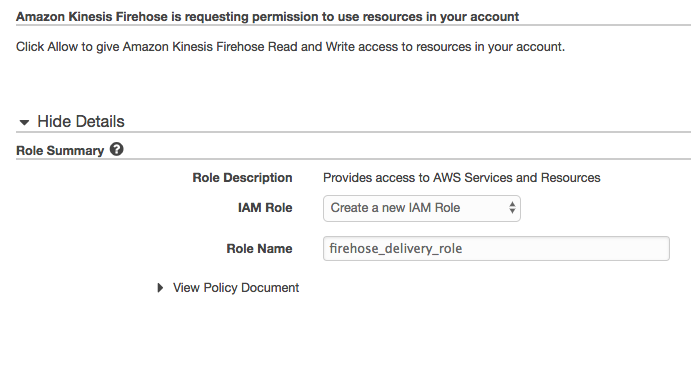 1. Proceed to the next step by selecting **Allow**. 1. Verify that the settings are configured as above, and finish the wizard by selecting **Create delivery stream**. This will take 5-7 min to complete creating the new stream.
[Reference link](https://docs.aws.amazon.com/systems-manager/latest/userguide/session-manager-working-with-sessions-start.html) 1. In the AWS Management Console select **Services** then select **Systems Manager** under Management Tools. 1. In the service console, select **Session Manager** from the left hand panel and select **Start Session** to list target instances. 1. You should be able to see our web server instance. Select the instance and open a new SSH session window by selecting **Start Session**. 1. In the new SSH session, change to root user by entering sudo -s.
1. Download and Install the [Kinesis Agent](https://docs.aws.amazon.com/streams/latest/dev/writing-with-agents.html) using the following command. As the EC2 instance has an attached IAM role, you can skip the pre-requisites referring to IAM or AWS credentials (the Agent will do this automatically) in the reference link.
```shell
sudo yum install aws-kinesis-agent -y
```
1. Now we will configure the Kinesis Agent to use the Kinesis Firehose we created previously, and to parse the apache log file.
1. Verify if you have correct permissions to read the file by opening the file. If you see permission denied, you may have to use chmod to change the permission for the directory.
```shell
tail /var/log/httpd/access_log
```
1. Change the permission for the httpd log directory for Kinesis Agent to parse apache logs with the following command.
```shell
sudo chmod 777 -R /var/log/httpd/
```
1. Use your favourite editor (vim, nano, pico or Emacs if you're brave!) to open and edit the configuration file `/etc/aws-kinesis/agent.json`. Hint: You can delete lines at a time by
```shell
sudo nano /etc/aws-kinesis/agent.json
```
1. You can use the configuration syntax in the [Kinesis Agent documentation](https://docs.aws.amazon.com/streams/latest/dev/writing-with-agents.html#agent-config-settings) page, or use settings below.
`Remember to change the values to your own resource names!`
**firehose.endpoint:** Firehose regional endpoint
**filePattern:** Path to our log file. Appending the wildcard will allow the Agent to pick up rotating log files (eg. when you accidently delete and create it again)
**deliveryStream:** Friendly name of your Firehose (eg. webserver_stream)
```json
{
"cloudwatch.emitMetrics": true,
"firehose.endpoint": "https://firehose.ap-southeast-2.amazonaws.com",
"flows": [
{
"filePattern": "/var/log/httpd/access_log*",
"deliveryStream": "
1. In the AWS Management Console select **Services** then select **Elasticsearch Service** under Analytics. 1. After selecting your ES instance, open the Kibana dashboard by opening the respective URL under **Overview**. If you get an access denied message, verify if your IP address is whitelisted under **Modify access policy**. 1. Within Kibana, select **Management** on the left hand panel. 1. Select **Index Patterns**, then **Create Index Pattern**. This will allow us to add our index for Kibana to use as a data source. 1. You should be able to see your Index name such as `apache`. Enter it in **Index pattern** and proceed via **Next Step**. 1. Under **Configure Settings**, use the drop down menu to select **@timestamp**. Back in our ETL Lambda function, we changed the timestamp format to be compatible with Kibana. 1. Finish the wizard by selecting **Create index pattern**. If it is successful, you should be able to see multiple Fields from the incoming data. 1. Take a moment to look at the streaming data by selecting **Discover** on the left hand panel. 1. If you don't see the requests that you generated previously on the website, use the **Auto-refresh** at the top of the page with 5 seconds interval to continually refresh the index. 1. Try creating your own visualisation from the Visualize menu on the left hand panel. For example, if you want to represent number of HTTP response codes: + Create a new **Pie** chart + Select your index that you added previously + Under Buckets, select **Split Slices** + Select the type **Terms** for Aggregation + Use **Field** to add **Response** + Apply changes to see the generated visual + If you only see 200 responses (from the Load Balancer health check requests), try generating some 404 response by requesting non-existing URL paths on your website.
1. SSH into your Wordpress instance 1. Change into the working directory ```shell [ec2-user@ip-172-31-11-210 ~]$ cd /home/ec2-user/module2 [ec2-user@ip-172-31-11-210 module2]$ ls clickstream.py produce.sh ``` 1. Run the shell script, which will continually invoke the python script in a loop. ```shell [ec2-user@ip-172-31-11-210 module2]$ sudo chmod +x produce.sh [ec2-user@ip-172-31-11-210 module2]$ . produce.sh Generating new clickstream log at /var/log/httpd/access_log Press [CTRL+C] to stop.. Generating new clickstream log at /var/log/httpd/access_log Press [CTRL+C] to stop.. ``` ```shell [ec2-user@ip-172-31-11-210 module2]$ tail -f /var/log/httpd/access_log 162.250.88.82 - - [03/Nov/2018:04:29:26 +0000] "POST home/ HTTP/1.1" 200 20494 "www.unicornshop.com/categories//" "Mozilla/5.0 (Linux; U; Android-4.0.3; en-us; Galaxy Nexus Build/IML74K) AppleWebKit/535.7 (KHTML, like Gecko) CrMo/16.0.912.75 Mobile Safari/535.7" "user = anonymous; PHPSESSID=903f966790f4452e8b695267efe93a99" 187.74.103.143 - - [03/Nov/2018:04:29:29 +0000] "GET products/Meeqeos/ HTTP/1.1" 403 37679 "www.unicornshop.com/home/" "Mozilla/5.0 (iPhone; CPU iPhone OS 10_3_1 like Mac OS X) AppleWebKit/603.1.30 (KHTML, like Gecko) Version/10.0 Mobile/14E304 Safari/602.1" "user = anonymous; PHPSESSID=2ef5dd310f9c4a2781a9145d190909d5" 172.31.4.149 - - [03/Nov/2018:04:29:31 +0000] "GET /wordpress/ HTTP/1.1" 200 55172 "-" "ELB-HealthChecker/2.0" ``` 1. Whilst the script is running, have a look at your Kibana to see the incoming new data in the **Discover** page. `For this workshop, it's recommended to change the Time Range to a smaller window such as Last 1 hour`