# AWS Observability Accelerator for Terraform
[](https://github.com/aws-observability/terraform-aws-observability-accelerator/actions/workflows/pre-commit.yaml)
[](https://github.com/aws-observability/terraform-aws-observability-accelerator/actions/workflows/plan-examples.yml)
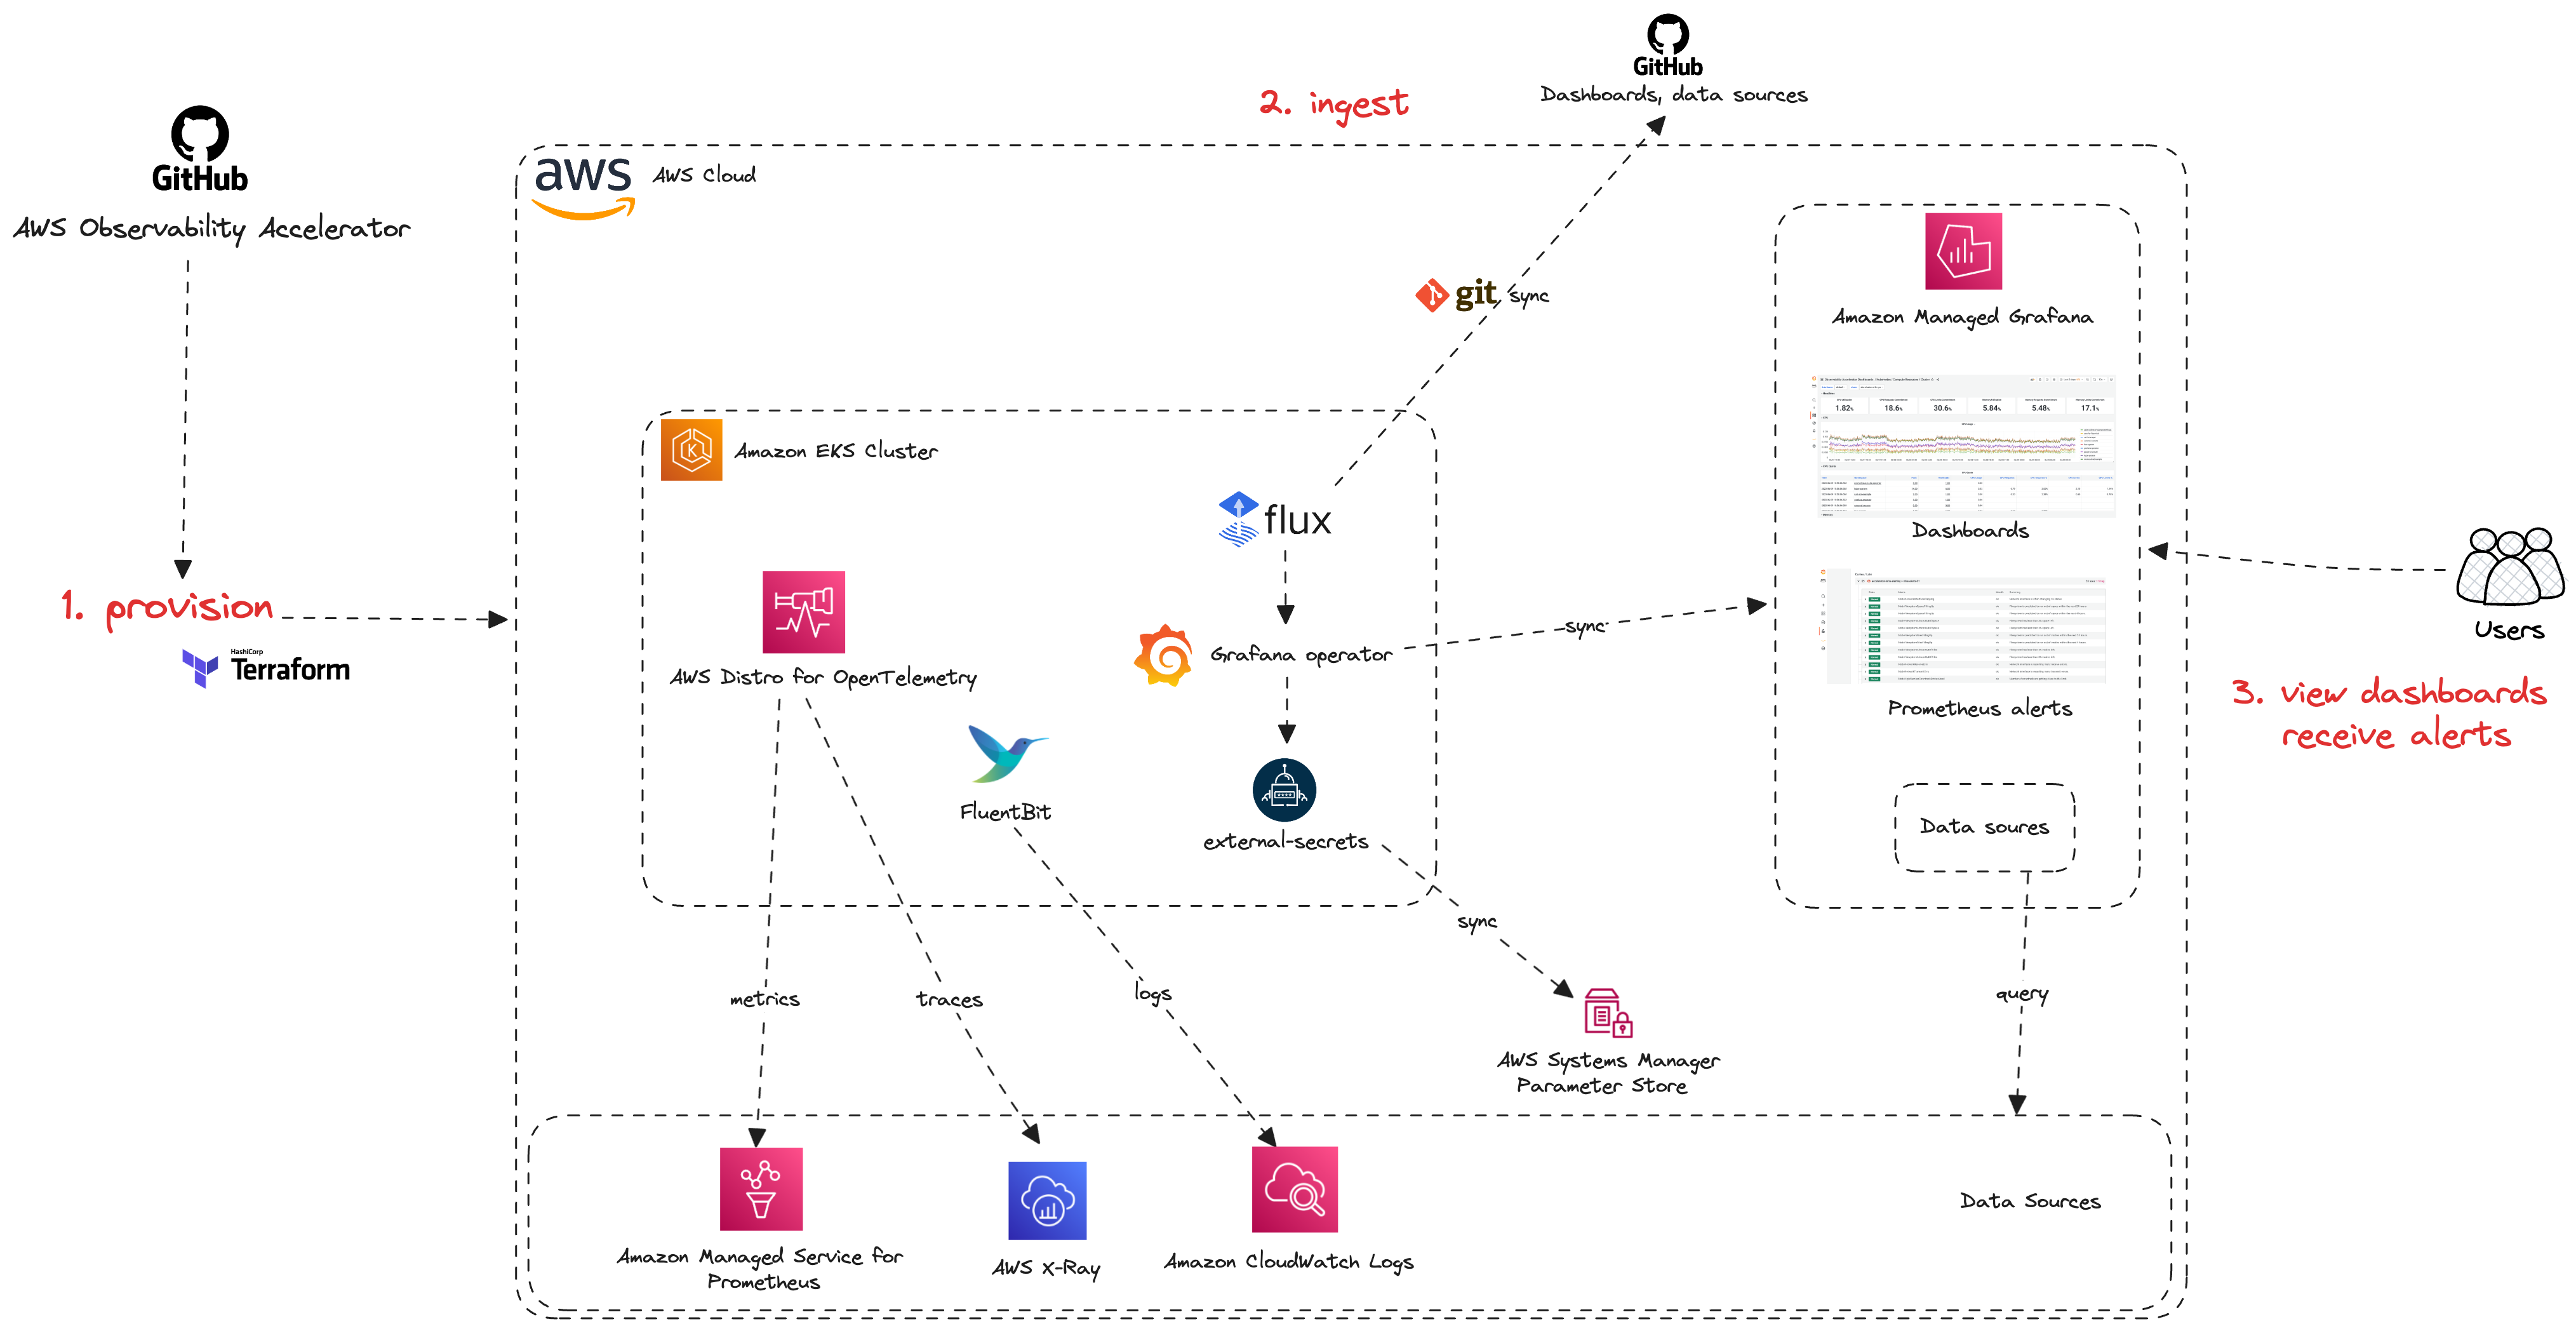
Welcome to the AWS Observability Accelerator for Terraform!
The AWS Observability Accelerator for Terraform is a set of opinionated modules
to help you set up observability for your AWS environments with
AWS-managed observability services such as Amazon Managed Service for Prometheus,
Amazon Managed Grafana, AWS Distro for OpenTelemetry (ADOT) and Amazon CloudWatch.
We provide curated metrics, logs, traces collection, alerting rules and Grafana
dashboards for your EKS infrastructure, Java/JMX, NGINX based workloads and
your custom applications.
You also can monitor your Amazon Managed Service for Prometheus workspaces ingestion,
costs, active series with [this module](./modules/managed-prometheus-monitoring).
## Documentation
To explore the complete project documentation, please visit our [documentation site.](https://aws-observability.github.io/terraform-aws-observability-accelerator/)
## ⚠️ Migration to v2.5
If you are migrating from earlier versions to v2.5, please follow this guide.
v2.5.0 removes the dependency to the Terraform Grafana provider in the EKS
monitoring module. As Grafana Operator manages and syncs the Grafana contents,
Terraform is not required anymore in this context.
However, if you migrate from earlier versions, you might leave some data orphans
as the Grafana provider is dropped. Terraform will throw an error. We have
released [v2.5.0-rc.1](https://github.com/aws-observability/terraform-aws-observability-accelerator/releases/tag/v2.5.0-rc.1)
which removes all the Grafana resources provisioned by Terraform in the EKS
context, without removing the provider configurations.
- Step 1: migrate to [v2.5.0-rc.1](https://github.com/aws-observability/terraform-aws-observability-accelerator/releases/tag/v2.5.0-rc.1)
and run `apply`
- Step 2: migrate to `v2.5.0` or above
## Getting started
To quick start with a complete workflow and view Amazon EKS infrastructure dashboards,
visit the [Amazon EKS cluster monitoring documentation](https://aws-observability.github.io/terraform-aws-observability-accelerator/eks/)
## How it works
The sections below demonstrate how you can leverage AWS Observability Accelerator
to enable monitoring to an existing EKS cluster.
### Base Module
The base module allows you to configure the AWS Observability services for your
cluster and the AWS Distro for OpenTelemetry (ADOT) Operator as the signals
collection mechanism.
This is the minimum configuration to have a new Amazon Managed Service for
Prometheus Workspace and ADOT Operator deployed for you and ready to receive
your data. The base module serve as an anchor to the workload modules and
cannot run on its own.
```hcl
module "aws_observability_accelerator" {
# use release tags and check for the latest versions
# https://github.com/aws-observability/terraform-aws-observability-accelerator/releases
source = "github.com/aws-observability/terraform-aws-observability-accelerator?ref=v2.1.0"
aws_region = "eu-west-1"
eks_cluster_id = "my-eks-cluster"
# As Grafana shares a different lifecycle, we recommend using an existing workspace.
managed_grafana_workspace_id = var.managed_grafana_workspace_id
}
```
You can optionally reuse an existing Amazon Managed Servce for Prometheus Workspace:
```hcl
module "aws_observability_accelerator" {
# use release tags and check for the latest versions
# https://github.com/aws-observability/terraform-aws-observability-accelerator/releases
source = "github.com/aws-observability/terraform-aws-observability-accelerator?ref=v2.1.0"
aws_region = "eu-west-1"
eks_cluster_id = "my-eks-cluster"
# prevents creation of a new Amazon Managed Prometheus workspace
enable_managed_prometheus = false
# reusing existing Amazon Managed Prometheus Workspace
managed_prometheus_workspace_id = "ws-abcd123..."
managed_grafana_workspace_id = "g-abcdef123"
}
```
View all the configuration options in the module documentation below.
### Workload modules
[Workloads modules](./modules) are provided, which essentially provide curated
metrics, logs, traces collection, alerting rules and Grafana dashboards.
#### Amazon EKS monitoring
```hcl
module "eks_monitoring" {
source = "github.com/aws-observability/terraform-aws-observability-accelerator//modules/eks-monitoring?ref=v2.1.0"
eks_cluster_id = module.eks_observability_accelerator.eks_cluster_id
dashboards_folder_id = module.eks_observability_accelerator.grafana_dashboards_folder_id
managed_prometheus_workspace_id = module.eks_observability_accelerator.managed_prometheus_workspace_id
managed_prometheus_workspace_endpoint = module.eks_observability_accelerator.managed_prometheus_workspace_endpoint
managed_prometheus_workspace_region = module.eks_observability_accelerator.managed_prometheus_workspace_region
enable_logs = true
enable_tracing = true
}
```
Grafana Dashboards
 Check the the [complete example](./examples/existing-cluster-with-base-and-infra/)
## Motivation
To gain deep visibility into your workloads and environments, AWS proposes a
set of secure, scalable, highly available, production-grade managed open
source services such as Amazon Managed Service for Prometheus, Amazon Managed
Grafana and Amazon OpenSearch.
AWS customers have asked for best-practices and guidance to collect metrics, logs
and traces from their containerized applications and microservices with ease of
deployment. Customers can use the AWS Observability Accelerator to configure their
metrics and traces collection, leveraging [AWS Distro for OpenTelemetry](https://aws-otel.github.io/),
to have opinionated dashboards and alerts available in only minutes.
## Support & Feedback
AWS Observability Accelerator for Terraform is maintained by AWS Solution
Architects. It is not part of an AWS service and support is provided best-effort
by the AWS Observability Accelerator community.
To post feedback, submit feature ideas, or report bugs, please use the
[Issues](https://github.com/aws-observability/terraform-aws-observability-accelerator/issues)
section of this GitHub repo.
If you are interested in contributing, see the
[Contribution guide](https://github.com/aws-observability/terraform-aws-observability-accelerator/blob/main/CONTRIBUTING.md).
---
## Requirements
| Name | Version |
|------|---------|
| [terraform](#requirement\_terraform) | >= 1.1.0 |
| [aws](#requirement\_aws) | >= 4.0.0 |
| [awscc](#requirement\_awscc) | >= 0.24.0 |
## Providers
| Name | Version |
|------|---------|
| [aws](#provider\_aws) | >= 4.0.0 |
## Modules
No modules.
## Resources
| Name | Type |
|------|------|
| [aws_prometheus_alert_manager_definition.this](https://registry.terraform.io/providers/hashicorp/aws/latest/docs/resources/prometheus_alert_manager_definition) | resource |
| [aws_prometheus_workspace.this](https://registry.terraform.io/providers/hashicorp/aws/latest/docs/resources/prometheus_workspace) | resource |
| [aws_grafana_workspace.this](https://registry.terraform.io/providers/hashicorp/aws/latest/docs/data-sources/grafana_workspace) | data source |
| [aws_region.current](https://registry.terraform.io/providers/hashicorp/aws/latest/docs/data-sources/region) | data source |
## Inputs
| Name | Description | Type | Default | Required |
|------|-------------|------|---------|:--------:|
| [aws\_region](#input\_aws\_region) | AWS Region | `string` | n/a | yes |
| [enable\_alertmanager](#input\_enable\_alertmanager) | Creates Amazon Managed Service for Prometheus AlertManager for all workloads | `bool` | `false` | no |
| [enable\_managed\_prometheus](#input\_enable\_managed\_prometheus) | Creates a new Amazon Managed Service for Prometheus Workspace | `bool` | `true` | no |
| [managed\_grafana\_workspace\_id](#input\_managed\_grafana\_workspace\_id) | Amazon Managed Grafana Workspace ID | `string` | n/a | yes |
| [managed\_prometheus\_workspace\_id](#input\_managed\_prometheus\_workspace\_id) | Amazon Managed Service for Prometheus Workspace ID | `string` | `""` | no |
| [managed\_prometheus\_workspace\_region](#input\_managed\_prometheus\_workspace\_region) | Region where Amazon Managed Service for Prometheus is deployed | `string` | `null` | no |
| [tags](#input\_tags) | Additional tags (e.g. `map('BusinessUnit`,`XYZ`) | `map(string)` | `{}` | no |
## Outputs
| Name | Description |
|------|-------------|
| [aws\_region](#output\_aws\_region) | AWS Region |
| [managed\_grafana\_workspace\_endpoint](#output\_managed\_grafana\_workspace\_endpoint) | Amazon Managed Grafana workspace endpoint |
| [managed\_prometheus\_workspace\_endpoint](#output\_managed\_prometheus\_workspace\_endpoint) | Amazon Managed Prometheus workspace endpoint |
| [managed\_prometheus\_workspace\_id](#output\_managed\_prometheus\_workspace\_id) | Amazon Managed Prometheus workspace ID |
| [managed\_prometheus\_workspace\_region](#output\_managed\_prometheus\_workspace\_region) | Amazon Managed Prometheus workspace region |
## Contributing
See [CONTRIBUTING](CONTRIBUTING.md#security-issue-notifications) for more information.
## License
Apache-2.0 Licensed. See [LICENSE](https://github.com/aws-observability/terraform-aws-observability-accelerator/blob/main/LICENSE).
Check the the [complete example](./examples/existing-cluster-with-base-and-infra/)
## Motivation
To gain deep visibility into your workloads and environments, AWS proposes a
set of secure, scalable, highly available, production-grade managed open
source services such as Amazon Managed Service for Prometheus, Amazon Managed
Grafana and Amazon OpenSearch.
AWS customers have asked for best-practices and guidance to collect metrics, logs
and traces from their containerized applications and microservices with ease of
deployment. Customers can use the AWS Observability Accelerator to configure their
metrics and traces collection, leveraging [AWS Distro for OpenTelemetry](https://aws-otel.github.io/),
to have opinionated dashboards and alerts available in only minutes.
## Support & Feedback
AWS Observability Accelerator for Terraform is maintained by AWS Solution
Architects. It is not part of an AWS service and support is provided best-effort
by the AWS Observability Accelerator community.
To post feedback, submit feature ideas, or report bugs, please use the
[Issues](https://github.com/aws-observability/terraform-aws-observability-accelerator/issues)
section of this GitHub repo.
If you are interested in contributing, see the
[Contribution guide](https://github.com/aws-observability/terraform-aws-observability-accelerator/blob/main/CONTRIBUTING.md).
---
## Requirements
| Name | Version |
|------|---------|
| [terraform](#requirement\_terraform) | >= 1.1.0 |
| [aws](#requirement\_aws) | >= 4.0.0 |
| [awscc](#requirement\_awscc) | >= 0.24.0 |
## Providers
| Name | Version |
|------|---------|
| [aws](#provider\_aws) | >= 4.0.0 |
## Modules
No modules.
## Resources
| Name | Type |
|------|------|
| [aws_prometheus_alert_manager_definition.this](https://registry.terraform.io/providers/hashicorp/aws/latest/docs/resources/prometheus_alert_manager_definition) | resource |
| [aws_prometheus_workspace.this](https://registry.terraform.io/providers/hashicorp/aws/latest/docs/resources/prometheus_workspace) | resource |
| [aws_grafana_workspace.this](https://registry.terraform.io/providers/hashicorp/aws/latest/docs/data-sources/grafana_workspace) | data source |
| [aws_region.current](https://registry.terraform.io/providers/hashicorp/aws/latest/docs/data-sources/region) | data source |
## Inputs
| Name | Description | Type | Default | Required |
|------|-------------|------|---------|:--------:|
| [aws\_region](#input\_aws\_region) | AWS Region | `string` | n/a | yes |
| [enable\_alertmanager](#input\_enable\_alertmanager) | Creates Amazon Managed Service for Prometheus AlertManager for all workloads | `bool` | `false` | no |
| [enable\_managed\_prometheus](#input\_enable\_managed\_prometheus) | Creates a new Amazon Managed Service for Prometheus Workspace | `bool` | `true` | no |
| [managed\_grafana\_workspace\_id](#input\_managed\_grafana\_workspace\_id) | Amazon Managed Grafana Workspace ID | `string` | n/a | yes |
| [managed\_prometheus\_workspace\_id](#input\_managed\_prometheus\_workspace\_id) | Amazon Managed Service for Prometheus Workspace ID | `string` | `""` | no |
| [managed\_prometheus\_workspace\_region](#input\_managed\_prometheus\_workspace\_region) | Region where Amazon Managed Service for Prometheus is deployed | `string` | `null` | no |
| [tags](#input\_tags) | Additional tags (e.g. `map('BusinessUnit`,`XYZ`) | `map(string)` | `{}` | no |
## Outputs
| Name | Description |
|------|-------------|
| [aws\_region](#output\_aws\_region) | AWS Region |
| [managed\_grafana\_workspace\_endpoint](#output\_managed\_grafana\_workspace\_endpoint) | Amazon Managed Grafana workspace endpoint |
| [managed\_prometheus\_workspace\_endpoint](#output\_managed\_prometheus\_workspace\_endpoint) | Amazon Managed Prometheus workspace endpoint |
| [managed\_prometheus\_workspace\_id](#output\_managed\_prometheus\_workspace\_id) | Amazon Managed Prometheus workspace ID |
| [managed\_prometheus\_workspace\_region](#output\_managed\_prometheus\_workspace\_region) | Amazon Managed Prometheus workspace region |
## Contributing
See [CONTRIBUTING](CONTRIBUTING.md#security-issue-notifications) for more information.
## License
Apache-2.0 Licensed. See [LICENSE](https://github.com/aws-observability/terraform-aws-observability-accelerator/blob/main/LICENSE).