# Monitor Istio running on Amazon EKS
This example demonstrates how to use Terraform modules for AWS Observability Accelerator, EKS Blueprints with the Tetrate Istio Add-on and EKS monitoring for Istio.
The current example deploys the [AWS Distro for OpenTelemetry Operator](https://docs.aws.amazon.com/eks/latest/userguide/opentelemetry.html)
for Amazon EKS with its requirements and make use of an existing Amazon Managed Grafana workspace.
It creates a new Amazon Managed Service for Prometheus workspace unless provided with an existing one to reuse.
It uses the `EKS monitoring` [module](https://github.com/aws-observability/terraform-aws-observability-accelerator/tree/main/modules/eks-monitoring)
to provide an existing EKS cluster with an OpenTelemetry collector,
curated Grafana dashboards, Prometheus alerting and recording rules with multiple
configuration options for Istio.
## Prerequisites
Ensure that you have the following tools installed locally:
1. [aws cli](https://docs.aws.amazon.com/cli/latest/userguide/getting-started-install.html)
2. [kubectl](https://kubernetes.io/docs/tasks/tools/)
3. [terraform](https://learn.hashicorp.com/tutorials/terraform/install-cli)
4. [istioctl](https://istio.io/latest/docs/setup/getting-started/#download)
## Setup
This example uses a local terraform state. If you need states to be saved remotely,
on Amazon S3 for example, visit the [terraform remote states](https://www.terraform.io/language/state/remote) documentation
### 1. Clone the repo using the command below
```
git clone https://github.com/aws-observability/terraform-aws-observability-accelerator.git
```
### 2. Initialize terraform
```console
cd examples/eks-istio
terraform init
```
### 3. Amazon EKS Cluster
To run this example, you need to provide your EKS cluster name.
If you don't have a cluster ready, visit [this example](https://aws-observability.github.io/terraform-aws-observability-accelerator/helpers/new-eks-cluster/)
first to create a new one.
Add your cluster name for `eks_cluster_id="..."` to the `terraform.tfvars` or use an environment variable `export TF_VAR_eks_cluster_id=xxx`.
### 4. Amazon Managed Grafana workspace
To run this example you need an Amazon Managed Grafana workspace. If you have
an existing workspace, create an environment variable
`export TF_VAR_managed_grafana_workspace_id=g-xxx`.
To create a new one, visit [this example](https://aws-observability.github.io/terraform-aws-observability-accelerator/helpers/managed-grafana/).
> In the URL `https://g-xyz.grafana-workspace.eu-central-1.amazonaws.com`, the workspace ID would be `g-xyz`
### 5. Grafana API Key
Amazon Managed Service for Grafana provides a control plane API for generating Grafana API keys. We will provide to Terraform
a short lived API key to run the `apply` or `destroy` command.
Ensure you have necessary IAM permissions (`CreateWorkspaceApiKey, DeleteWorkspaceApiKey`)
```sh
export TF_VAR_grafana_api_key=`aws grafana create-workspace-api-key --key-name "observability-accelerator-$(date +%s)" --key-role ADMIN --seconds-to-live 1200 --workspace-id $TF_VAR_managed_grafana_workspace_id --query key --output text`
```
## Deploy
Simply run this command to deploy (if using a variable definition file)
```sh
terraform apply -var-file=terraform.tfvars
```
or if you had setup environment variables, run
```sh
terraform apply
```
## Additional configuration
For the purpose of the example, we have provided default values for some of the variables.
1. AWS Region
Specify the AWS Region where the resources will be deployed. Edit the `terraform.tfvars` file and modify `aws_region="..."`. You can also use environement variables `export TF_VAR_aws_region=xxx`.
2. Amazon Managed Service for Prometheus workspace
If you have an existing workspace, add `managed_prometheus_workspace_id=ws-xxx`
or use an environment variable `export TF_VAR_managed_prometheus_workspace_id=ws-xxx`.
## Visualization
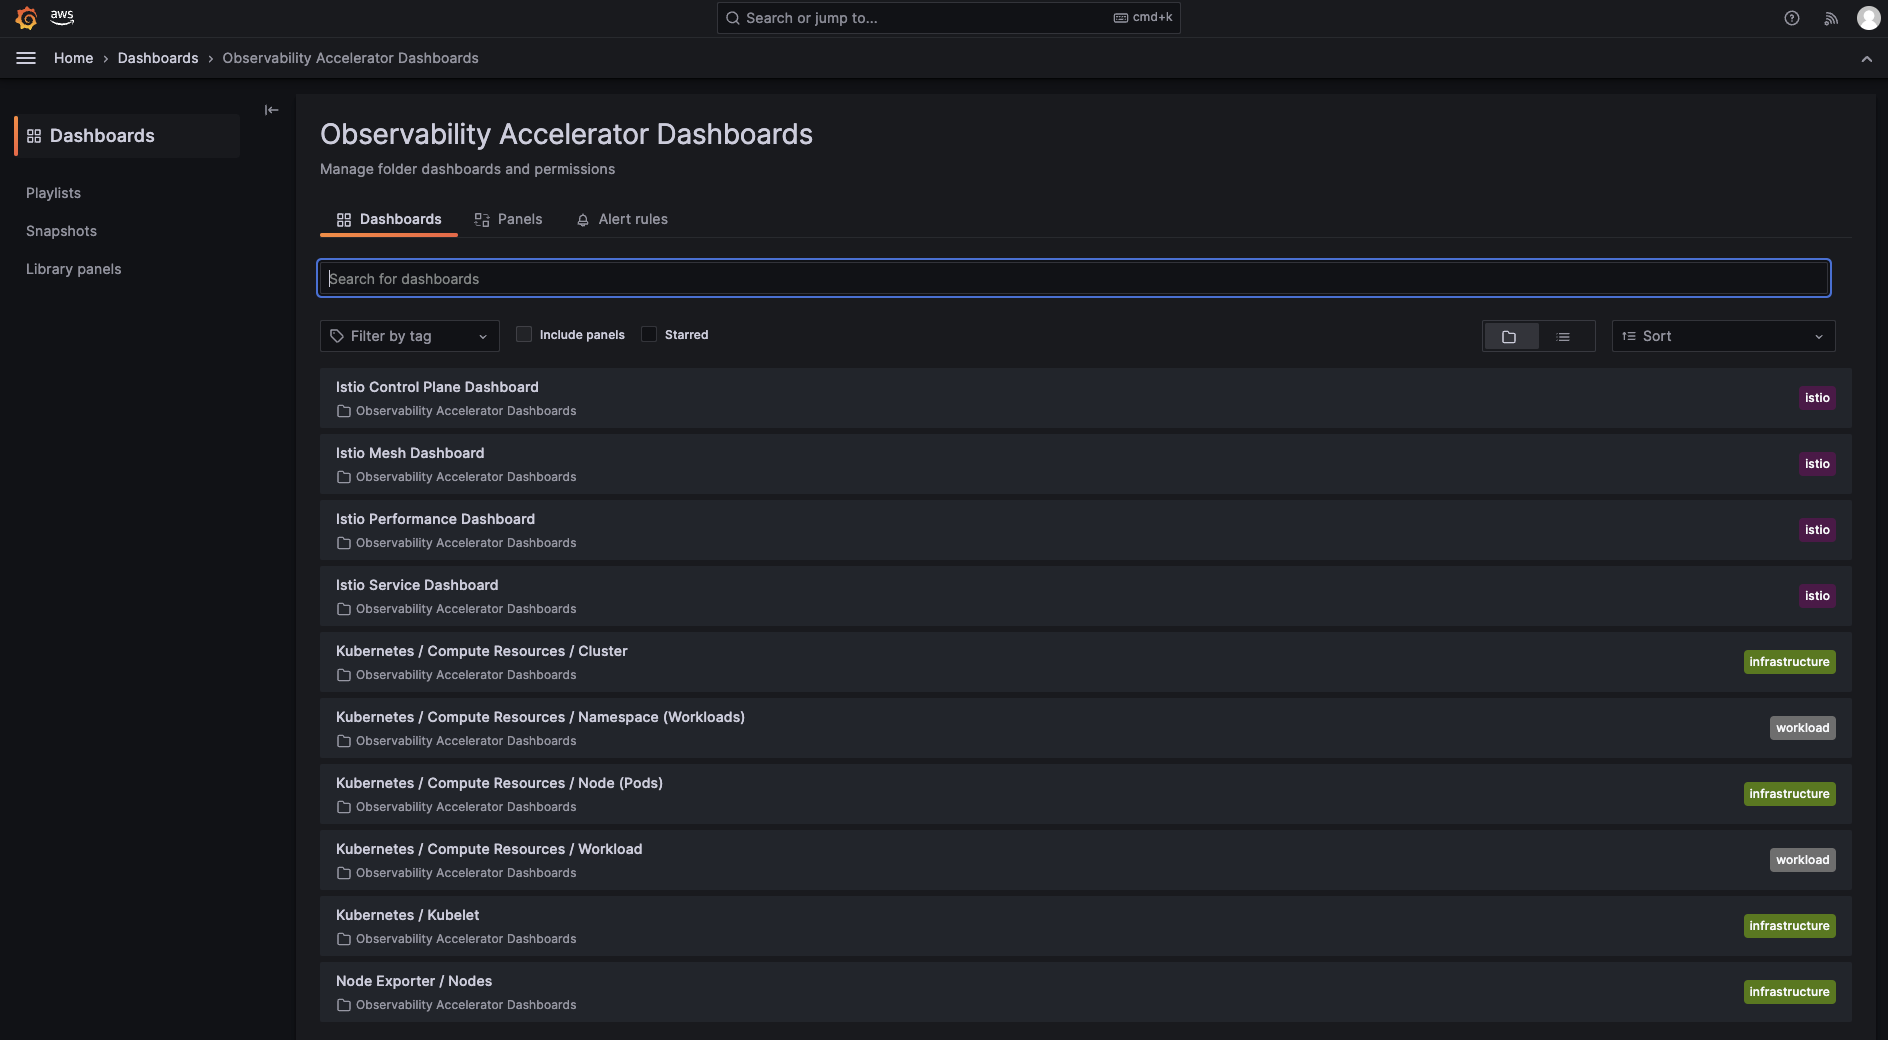
### 1. Grafana dashboards
Go to the Dashboards panel of your Grafana workspace. You will see a list of Istio dashboards under the `Observability Accelerator Dashboards`
 Open one of the Istio dasbhoards and you will be able to view its visualization
 ### 2. Amazon Managed Service for Prometheus rules and alerts
Open the Amazon Managed Service for Prometheus console and view the details of your workspace. Under the `Rules management` tab, you will find new rules deployed.
### 2. Amazon Managed Service for Prometheus rules and alerts
Open the Amazon Managed Service for Prometheus console and view the details of your workspace. Under the `Rules management` tab, you will find new rules deployed.
 !!! note
To setup your alert receiver, with Amazon SNS, follow [this documentation](https://docs.aws.amazon.com/prometheus/latest/userguide/AMP-alertmanager-receiver.html)
## Deploy an example application to visualize metrics
In this section we will deploy Istio's Bookinfo sample application and extract metrics using the AWS OpenTelemetry collector. When downloading and configuring `istioctl`, there are samples included in the Istio package directory. The deployment files for Bookinfo are found in the `samples` folder. Additional details can be found on Istio's [Getting Started](https://istio.io/latest/docs/setup/getting-started/) documentation
### 1. Deploy the Bookinfo Application
1. Using the AWS CLI, configure kubectl so you can connect to your EKS cluster. Update for your region and EKS cluster name
```sh
aws eks update-kubeconfig --region --name
```
2. Label the default namespace for automatic Istio sidecar injection
```sh
kubectl label namespace default istio-injection=enabled
```
3. Navigate to the Istio folder location. For example, if using Istio v1.18.2 in Downloads folder:
```sh
cd ~/Downloads/istio-1.18.2
```
4. Deploy the Bookinfo sample application
```sh
kubectl apply -f samples/bookinfo/platform/kube/bookinfo.yaml
```
5. Connect the Bookinfo application with the Istio gateway
```sh
kubectl apply -f samples/bookinfo/networking/bookinfo-gateway.yaml
```
6. Validate that there are no issues with the Istio configuration
```sh
istioctl analyze
```
7. Get the DNS name of the load balancer for the Istio gateway
```sh
GATEWAY_URL=$(kubectl get svc istio-ingressgateway -n istio-system -o=jsonpath='{.status.loadBalancer.ingress[0].hostname}')
```
### 2. Generate traffic for the Istio Bookinfo sample application
For the Bookinfo sample application, visit `http://$GATEWAY_URL/productpage` in your web browser. To see trace data, you must send requests to your service. The number of requests depends on Istio’s sampling rate and can be configured using the Telemetry API. With the default sampling rate of 1%, you need to send at least 100 requests before the first trace is visible. To send a 100 requests to the productpage service, use the following command:
```sh
for i in $(seq 1 100); do curl -s -o /dev/null "http://$GATEWAY_URL/productpage"; done
```
### 3. Explore the Istio dashboards
Log back into your Amazon Managed Grafana workspace and navigate to the dashboard side panel. Click on the `Observability Accelerator Dashboards` folder and open the `Istio Service` Dashboard. Use the Service dropdown menu to select the `reviews.default.svc.cluster.local` service. This gives details about metrics for the service, client workloads (workloads that are calling this service), and service workloads (workloads that are providing this service).
Explore the Istio Control Plane, Mesh, and Performance dashboards as well.
## Destroy
To teardown and remove the resources created in this example:
```sh
kubectl delete -f samples/bookinfo/networking/bookinfo-gateway.yaml
kubectl delete -f samples/bookinfo/platform/kube/bookinfo.yaml
terraform destroy
```
!!! note
To setup your alert receiver, with Amazon SNS, follow [this documentation](https://docs.aws.amazon.com/prometheus/latest/userguide/AMP-alertmanager-receiver.html)
## Deploy an example application to visualize metrics
In this section we will deploy Istio's Bookinfo sample application and extract metrics using the AWS OpenTelemetry collector. When downloading and configuring `istioctl`, there are samples included in the Istio package directory. The deployment files for Bookinfo are found in the `samples` folder. Additional details can be found on Istio's [Getting Started](https://istio.io/latest/docs/setup/getting-started/) documentation
### 1. Deploy the Bookinfo Application
1. Using the AWS CLI, configure kubectl so you can connect to your EKS cluster. Update for your region and EKS cluster name
```sh
aws eks update-kubeconfig --region --name
```
2. Label the default namespace for automatic Istio sidecar injection
```sh
kubectl label namespace default istio-injection=enabled
```
3. Navigate to the Istio folder location. For example, if using Istio v1.18.2 in Downloads folder:
```sh
cd ~/Downloads/istio-1.18.2
```
4. Deploy the Bookinfo sample application
```sh
kubectl apply -f samples/bookinfo/platform/kube/bookinfo.yaml
```
5. Connect the Bookinfo application with the Istio gateway
```sh
kubectl apply -f samples/bookinfo/networking/bookinfo-gateway.yaml
```
6. Validate that there are no issues with the Istio configuration
```sh
istioctl analyze
```
7. Get the DNS name of the load balancer for the Istio gateway
```sh
GATEWAY_URL=$(kubectl get svc istio-ingressgateway -n istio-system -o=jsonpath='{.status.loadBalancer.ingress[0].hostname}')
```
### 2. Generate traffic for the Istio Bookinfo sample application
For the Bookinfo sample application, visit `http://$GATEWAY_URL/productpage` in your web browser. To see trace data, you must send requests to your service. The number of requests depends on Istio’s sampling rate and can be configured using the Telemetry API. With the default sampling rate of 1%, you need to send at least 100 requests before the first trace is visible. To send a 100 requests to the productpage service, use the following command:
```sh
for i in $(seq 1 100); do curl -s -o /dev/null "http://$GATEWAY_URL/productpage"; done
```
### 3. Explore the Istio dashboards
Log back into your Amazon Managed Grafana workspace and navigate to the dashboard side panel. Click on the `Observability Accelerator Dashboards` folder and open the `Istio Service` Dashboard. Use the Service dropdown menu to select the `reviews.default.svc.cluster.local` service. This gives details about metrics for the service, client workloads (workloads that are calling this service), and service workloads (workloads that are providing this service).
Explore the Istio Control Plane, Mesh, and Performance dashboards as well.
## Destroy
To teardown and remove the resources created in this example:
```sh
kubectl delete -f samples/bookinfo/networking/bookinfo-gateway.yaml
kubectl delete -f samples/bookinfo/platform/kube/bookinfo.yaml
terraform destroy
```