# Test Folder
This folder contains a demo that includes a simulated application with several services.
It also includes an Nginx web server which has a fluent-bit agent that reports access log traffic to opensearch Observability data-stream.
## Services Demo Instructions
This demo includes a simulated multi-services system that contains:
- nginx server
- flask-app
- opensearch cluster
- fluent-bit agent
- redis database
All these components function as a simulated application which generates network traffic that the nginx server records and the fluent-bit agent ingests
(after transforming into simple schema for observability log) into opensearch logs data-stream.
This ongoing system provides a live example for the dashboard's capability to monitor and reflect the nginx status as it collects the network traffic being sent
by the different components.
----
1. Start docker-compose docker compose up --build.
- `$ docker compose up`
- Ensure vm.max_map_count has been set to 262144 or higher (`sudo sysctl -w vm.max_map_count=262144`).
2. Add Simple Schema Logs index templates [Loading Logs](https://github.com/opensearch-project/opensearch-catalog/tree/main/docs/schema/)
- `curl -XPUT localhost:9200/_component_template/http_template -H "Content-Type: application/json" --data-binary @http.mapping`
- `curl -XPUT localhost:9200/_component_template/communication_template -H "Content-Type: application/json" --data-binary @communication.mapping`
- `curl -XPUT localhost:9200/_index_template/logs -H "Content-Type: application/json" --data-binary @logs.mapping`
3. Import the nginx dashboards to display the preloaded nginx access logs [dashboards](../assets/display/sso-logs-dashboard-new.ndjson)
- First add an index pattern `sso_logs-*-*`
`curl -X POST localhost:5601/api/saved_objects/index-pattern/sso_logs -H 'osd-xsrf: true' -H 'Content-Type: application/json' -d '{ "attributes": { "title": "sso_logs-*-*", "timeFieldName": "@timestamp" } }'`
- Load the [dashboards](../assets/display/sso-logs-dashboard-new.ndjson)
- `curl -X POST "localhost:5601/api/saved_objects/_import?overwrite=true" -H "osd-xsrf: true" --form file=@sso-logs-dashboard.ndjson`
4. Generate some traces by repeatedly pinging the `http://localhost:8080/` endpoint.
- The endpoint is programmed to fail randomly (“Random failureâ€), for demoing some visualizations it’s helpful to generate sufficiently many traces to see both results.
- The failure rate can be adjusted in test/flask-app/app.py, it will be live-reloaded.
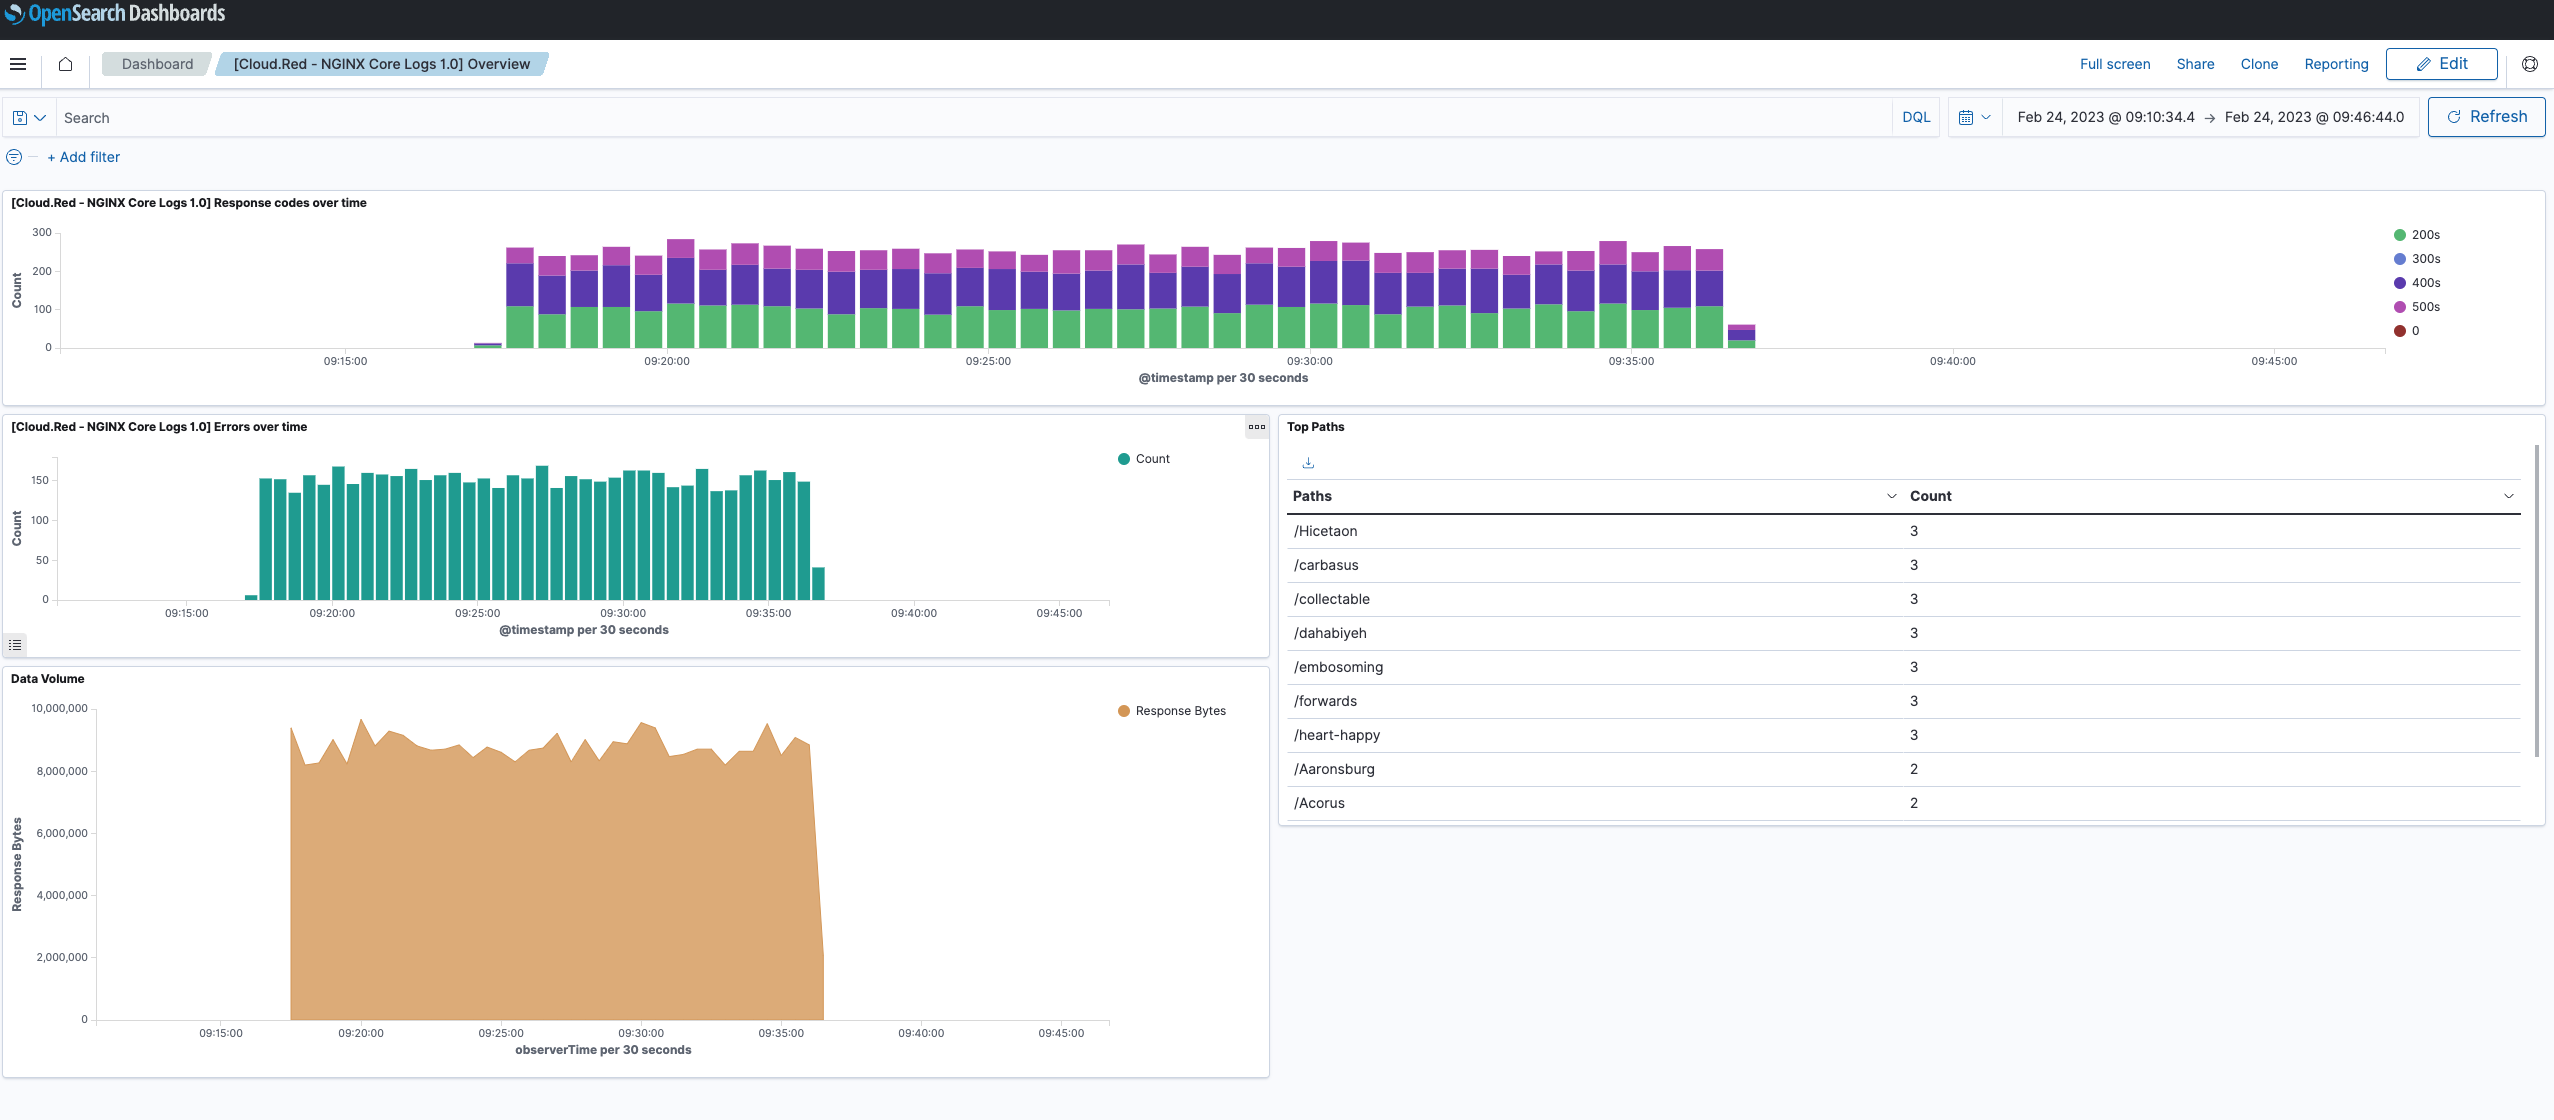
5. Open the dashboard and view the preloaded access logs
- Go to [Dashbords](http://localhost:5601/app/dashboards#/list?_g=(filters:!(),refreshInterval:(pause:!t,value:0),time:(from:'2023-02-24T17:10:34.442Z',to:'2023-02-24T17:46:44.056Z'))
- data-stream name :`sso_logs-nginx-prod`